This is an update of a blog that was originally posted in September 2019.
The Quarterly Census of Employment and Wages (QCEW) is the most accurate and comprehensive primary source for industry employment data in the United States. It is also the cornerstone of JobsEQ employment and wage data. However, due to limiting characteristics, we need to build upon QCEW in several ways:
(1) geographically, taking it from the country-level to smaller regions such zip codes;
(2) by the industry dimension, filling in non-disclosures using supplemental sources;
(3) by type, adding employment types not included in QCEW, such as the self-employed; and
(4) in time frame, bringing QCEW data forward one additional quarter per our Preliminary Estimates program.
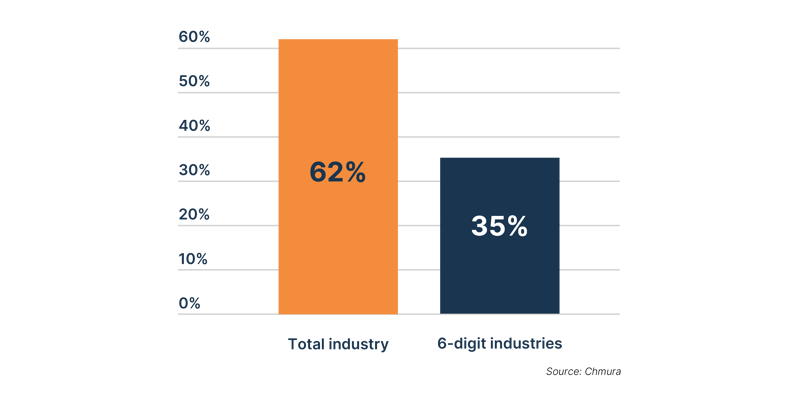
Based on a recent performance review, using the Preliminary Estimates in JobsEQ made the county-level covered employment data 62% more accurate than if those estimates were not available. Even at a detailed industry level such as the 6-digit NAICS, the preliminary data provided 35% more accuracy than without that information. (Definitions of these percentages are provided below.)
Accuracy improvement from JobsEQ preliminary employment data
The industry employment estimates are central in JobsEQ as they form the basis for other important data points, such as occupation employment, commuting statistics, and projected labor force demand. In turn, these metrics play roles in areas such as workforce development planning, program evaluation, and economic development efforts.
Technical notes on measuring the benefits
What does “62% and 35% better” cited above really mean? In measuring the accuracy of JobsEQ Preliminary Estimates for this evaluation, we compared four-quarter moving averages[1] of industry covered employment initially provided against actual QCEW employment data that was published later. For example, for evaluating our 2023 Q1 preliminary data we compared our 2022Q2-2023Q1 four quarter average initial vintage release against the later published QCEW data for the same period. We also used the QCEW for 2022Q1-2022q4 four quarter average as the baseline in this comparison as it represents what our JobsEQ clients would have had to use for the “most recent data” if Preliminary Estimates were not available.
For these comparison, we measured the difference for every detailed reporting unit: for each county in the nation, for each industry (at all NAICS levels), and for each ownership group.[2] We then summed all these differences from which we were able to determine how much closer the Preliminary Estimates were overall—that is, by comparing the differences sum computed with the availability of preliminary data to the differences sum computed as if the preliminary data were not available. Besides evaluating our 2023 Q1 as described above, we performed similar analyses for the 2022 Q2, Q3, and Q4 preliminary estimates and averaged the results together.
[1] Most analytics in JobsEQ use four-quarter moving averages of employment data rather than a single quarter—for various reasons, including having a more stable data set less subject to volatility and seasonality.
[2] The four ownership groups are federal, state, and local government in addition to the private sector. The preliminary employment being discussed here includes these four ownerships in aggregate, also known as covered employment. There is also non-covered employment data in JobsEQ (such as self-employment) and these data are presented with preliminary estimates as well, but measuring their accuracy against QCEW cannot be done, and so were not included in this analysis.