How JobEQ's Preliminary Estimates Keep You On Top of Labor Market Shifts


An updated version of this analysis has been published and can be found here.
Preliminary Estimates is an often-overlooked feature of JobsEQ. What these data are and why they are valuable is described below.
The Quarterly Census of Employment and Wages (QCEW) is the most accurate and comprehensive primary source for industry employment data in the United States. It also is the cornerstone of JobsEQ employment and wage data, which builds on QCEW and takes it farther:
- Geographically, taking it from the county to the zip code level and beyond;
- By the industry dimension, filling in non-disclosures using supplemental sources; and
- In time frame, bringing it forward two additional quarters per our Preliminary Estimates program.
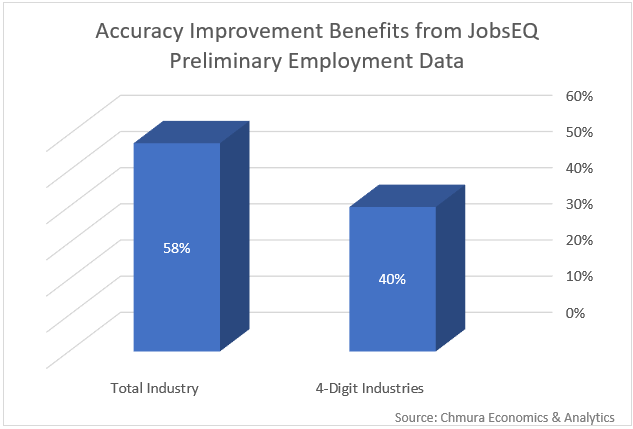
In a recent performance review, using the Preliminary Estimates in JobsEQ made the county-level employment data 58% more accurate than if those estimates were not available. Even at a detailed industry level such as the 4-digit NAICS,[1] the preliminary data provided 40% more accuracy than without. (Definitions of these percentages are provided below.)
Why Bother?
Even though it takes a lot of ongoing resources to produce Preliminary Estimates, we at Chmura believe that having the highest quality data is fundamental for supporting good decisions. An improvement such as that provided by the Preliminary Estimates process is thus well worth the effort.
While employment changes from one quarter to the next are sometimes mild, they can also be sharp. Especially in today’s economic climate, with recession speculation commonplace, future employment changes may well increase in magnitude. It is of great value to our clients to be on top of shifts in the labor market, to see which industries and occupations may be the most affected by economic adversity as well as growth spurts. Preliminary Estimates is an important part of helping our clients attain a state of readiness.
How Preliminary Estimates are Made
In February 2019, we computed one of JobsEQ’s quarterly updates.[2] At the time, the latest QCEW that was available was for the second quarter of 2018. In addition to using those QCEW data, we also computed Preliminary Estimates for the third and fourth quarters of the year, making the new JobsEQ employment and wage data a full six months more timely than simply matching the QCEW time frame.
Making good advanced estimates is no simple matter. For a solid methodological starting place, we use the Current Employment Statistics (CES) from the Bureau of Labor Statistics.
CES data are more timely job estimates compared to QCEW. However, the accuracy of CES compared to QCEW is not as strong nor is the level of detail or coverage.[3] So while CES cannot form the basis for the primary JobsEQ employment data, it can and does form a strong starting point for our Preliminary Estimates.
The CES data are simply not enough, however, for robust early estimates, especially at the detailed industry levels. Therefore, the Preliminary Estimates for JobsEQ also incorporate a variety of county-level industry trends as well as a careful modeling to optimize accuracy.
As an ongoing process, when the next quarter of QCEW data are released, work begins on incorporating those data into JobsEQ, replacing the preliminary data for that quarter and kicking off the process for generating preliminary employment for the following two quarters.
Notes on Measuring the Benefits
What does “58% and 40% better” cited above really mean? In measuring the accuracy of JobsEQ Preliminary Estimates in this particular case, we compared four-quarter moving averages[4] of industry employment available with our February set of data against actual QCEW employment data published later in the year. That is, we compared our February vintage 2018Q1-Q4 data against the later published QCEW data for 2018Q1-Q4. We also compared the later QCEW for 2018Q1-Q4 versus our February vintage 2017Q3-2018Q2 data, which represent what our JobsEQ clients would have had to use for the “most recent data” if Preliminary Estimates were not available.
For these comparison, we then measured the difference in each case: for each county in the nation, for each industry (at all NAICS levels), and for each ownership group[5]—for example, at the 4-digit NAICS level that would be as many as 1,256 data points per county. We then summed all these differences from which we were able to determine how much closer the Preliminary Estimates were overall—that is, by comparing the differences sum computed with the availability of preliminary data to the differences sum computed as if the preliminary data were not available.
[1] This industry level is particularly important in developing occupation employment estimates as described here.
[2] It is on this vintage data set that the performance review of preliminary data cited in this article was made.
[3] CES produces data for states and metropolitan areas, but not smaller geographies. CES also omits farm data and the industry data is not comprehensive. For many geographies, CES does not go below the 2-digit NAICS level.
[4] Most analytics in JobsEQ use four-quarter moving averages of employment data rather than a single quarter—for various reasons, including having a more stable data set less subject to volatility and seasonality.
[5] The four ownership groups being federal, state, and local government in addition to the private sector. The preliminary employment being discussed here includes these four ownerships in aggregate, also known as covered employment. There is also non-covered employment data in JobsEQ (such as self-employment) and these data are presented with preliminary estimates as well, but measuring their accuracy against QCEW cannot be done, and so were not included in this analysis.
Subscribe to the Weekly Economic Update
Subscribe to the Weekly Economic Update and get news delivered straight to your inbox.


