Since unknown counties are used in the Quarterly Census of Employment and Wages (QCEW), the cornerstone of detailed industry-based employment data, there are some important ramifications concerning the jobs that are reported in these counties, especially since—as is shown below—employment in these regions has significantly increased over the last several years.
Defining unknown regions and counties
In the QCEW data, employment data for every state are reported within one of the state’s counties.[1] This includes the geographic counties in the state (that is, the counties with physical locations) as well as a reporting unit for the establishments with “unknown or undefined” locations in that state. These reporting units we refer to as “unknown counties” for short. Every state has them: “Unknown or Undefined, Alabama,” “Unknown or Undefined, Alaska,” etc.
There could be varying reasons why an establishment gets reported in this unknown bucket rather than in a geographic county. One reason may be simply that location information for an establishment is not available—for example, if it wasn’t provided by the company, the location will be unknown. Another reason may be that a company located in one state has work-from-home employees operating in another state; these individuals, instead of being reported separately in each county where the individuals live, may be reported all together in their resident state’s unknown county.
Exploring growth trends
Data are not available that break out what percentage of employment in the unknown counties is due to which reporting scenario. Nevertheless, since the onset of COVID-19—corresponding with a rise in work-from-home practices for some employers—there has been a significant rise in unknown county employment.
Percentage of all employment in unknown counties of the USA
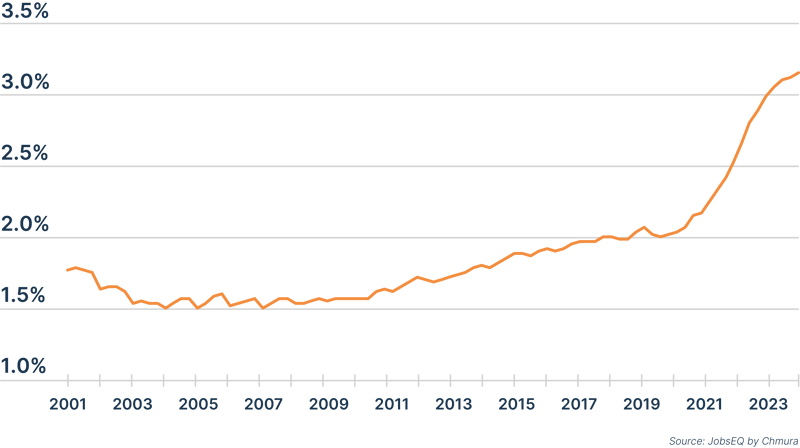
The above chart shows the aggregate employment in the unknown counties from all fifty states relative to overall covered employment in the nation. Going back as far as 2001, about 2.2% or less of all covered employment in the United States was reported in unknown counties. This shifted, however, in 2020, coinciding with the onset of COVID. By the third quarter of 2023, unknown county employment in the United States had climbed to 3.4%.[2]
The significance of increased employment in unknown counties
Accounting for just two or three percent of employment, the importance of unknown county employment may seem marginal at best. However, this employment is not evenly distributed and impacts some occupations groups much more than others.
Percent of jobs in unknown counties, Q3 2023
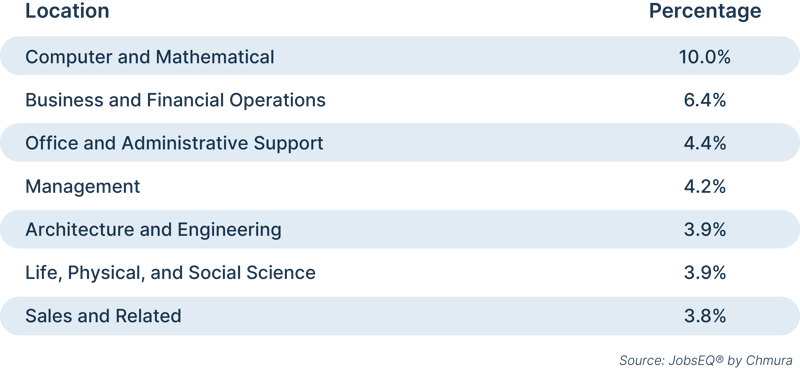
In the third quarter of 2023, ten percent of computer and mathematical jobs could be traced to establishments reported in unknown counties. Other white collar and traditional office positions were also more highly represented than average in these data. Unknown county employment in the third quarter of 2023 accounted for 6.4% of business and financial operations jobs and 4.4% of office and administrative support positions. Occupations least likely to be represented in unknown counties were food preparation and serving related jobs (0.7%) and educational instruction and library positions (0.8%).
Top industries in unknown counties, Q3 2023
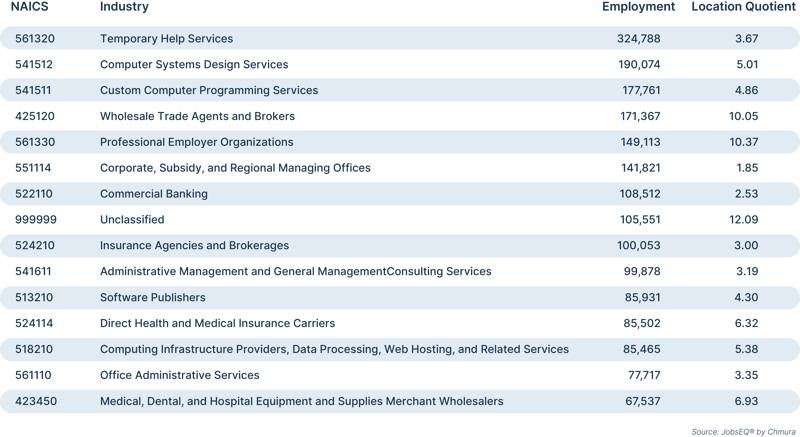
By industry, large amounts of employment in the unknown counties are due to companies in computer-related fields, finance and insurance, and wholesaling. The largest industry in unknown counties in the third quarter of 2023 was temporary help services followed by computer systems design services and custom computer programming services. The location quotients above indicate the concentration of the industries—for example, wholesale trade agents and brokers with a location quotient of about ten indicates that industry had ten times more employment in these unknown regions overall than we’d expect to find compared to average in the United States.
Accounting unknown county jobs in commuting data
This section specifically addresses how the unknown county jobs are treated within JobsEQ and how to account for these jobs when looking at commuting patterns.
Residents of Mason County, Kentucky, and where they work
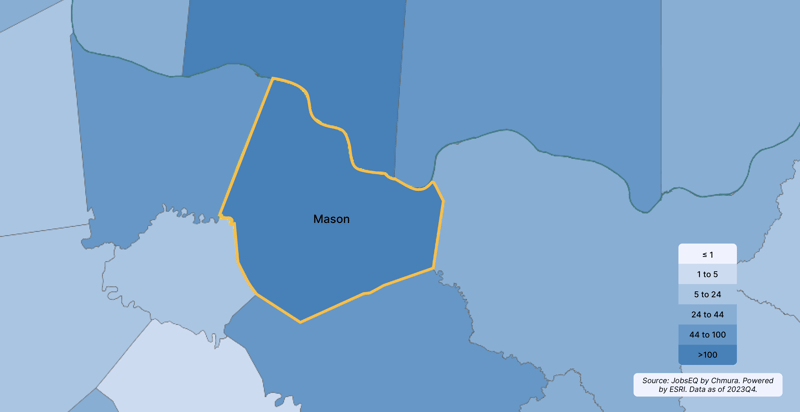
One way to access in-and-out commuting data in JobsEQ is via our Maps tool, as shown above in an example for Mason County, Kentucky. We can export these data from JobsEQ to find how many residents of Mason are working in other counties, both inside and outside of Kentucky. That data export will also include an estimate of how many Mason residents are counted as being workers in Unknown or Undefined, Kentucky (FIPS 21999).
One thing we know for sure about people working in the unknown Kentucky county is that they are working somewhere in Kentucky. Because of this, if you are calculating how many residents of Mason work in Kentucky, you would include all of the Mason commuters to the unknown Kentucky county in that summation.
Our commuting model is guided by data from the Census American Community Survey (ACS). For example, per Table S0801, the 2022 5-year ACS dataset, 87.5% of Mason County employed residents worked in their state of residence and 70.5% worked in their county of residence. Our commuting model uses these ACS data as benchmarks. Unknown counties are also incorporated into that overall commuting model and hold consistent with these ACS data. Maintaining this consistency, however, results in a bit of complexity in the following scenario.
Suppose you want to estimate how many residents of Mason County are also working in Mason County. In this case, some of the commuters to the unknown county have to be taken into account. This may be hard to follow, but basically: we know these workers in the unknown Kentucky county are working somewhere in Kentucky but not exactly where, so our assumption is that they follow the same distribution as the other in-state commuters.
So, for example, if the percentage of Mason County residents who work in Kentucky is 87.5% and the percentage of Mason County residents who work in Mason County is 70.5%, we use the ratio of these percentages to allocate how many Mason County residents commuting to the unknown county are estimated to be actually working in the geographic Mason County (70.5% / 87.5% = 80.6% of the Mason County residents “commuting to” the unknown county in Kentucky are actually working in Mason County).
Bottom line, however, you don’t need to worry about this calculation for your county—we do the math for you in JobsEQ and show total in-and-out commuting numbers in our Demographic Profile “Region Stats” table. If you’re trying to reconcile those numbers, however, with a county-by-county accounting, then this method will help you through that.
[1] “Counties” here means county equivalent. Some states have entities that function like counties for reporting purposes but are called something else: for example, “parishes” in Louisiana and “boroughs” in Alaska.
[2] “Covered employment" in this paragraph refers to the employment data that are included in the QCEW. Compared to all employment, the percentage of unknown county employment is slightly lower, for example: 3.2% in the third quarter of 2023.