COVID-19: RTI Volume Mostly Flat Since the End of May

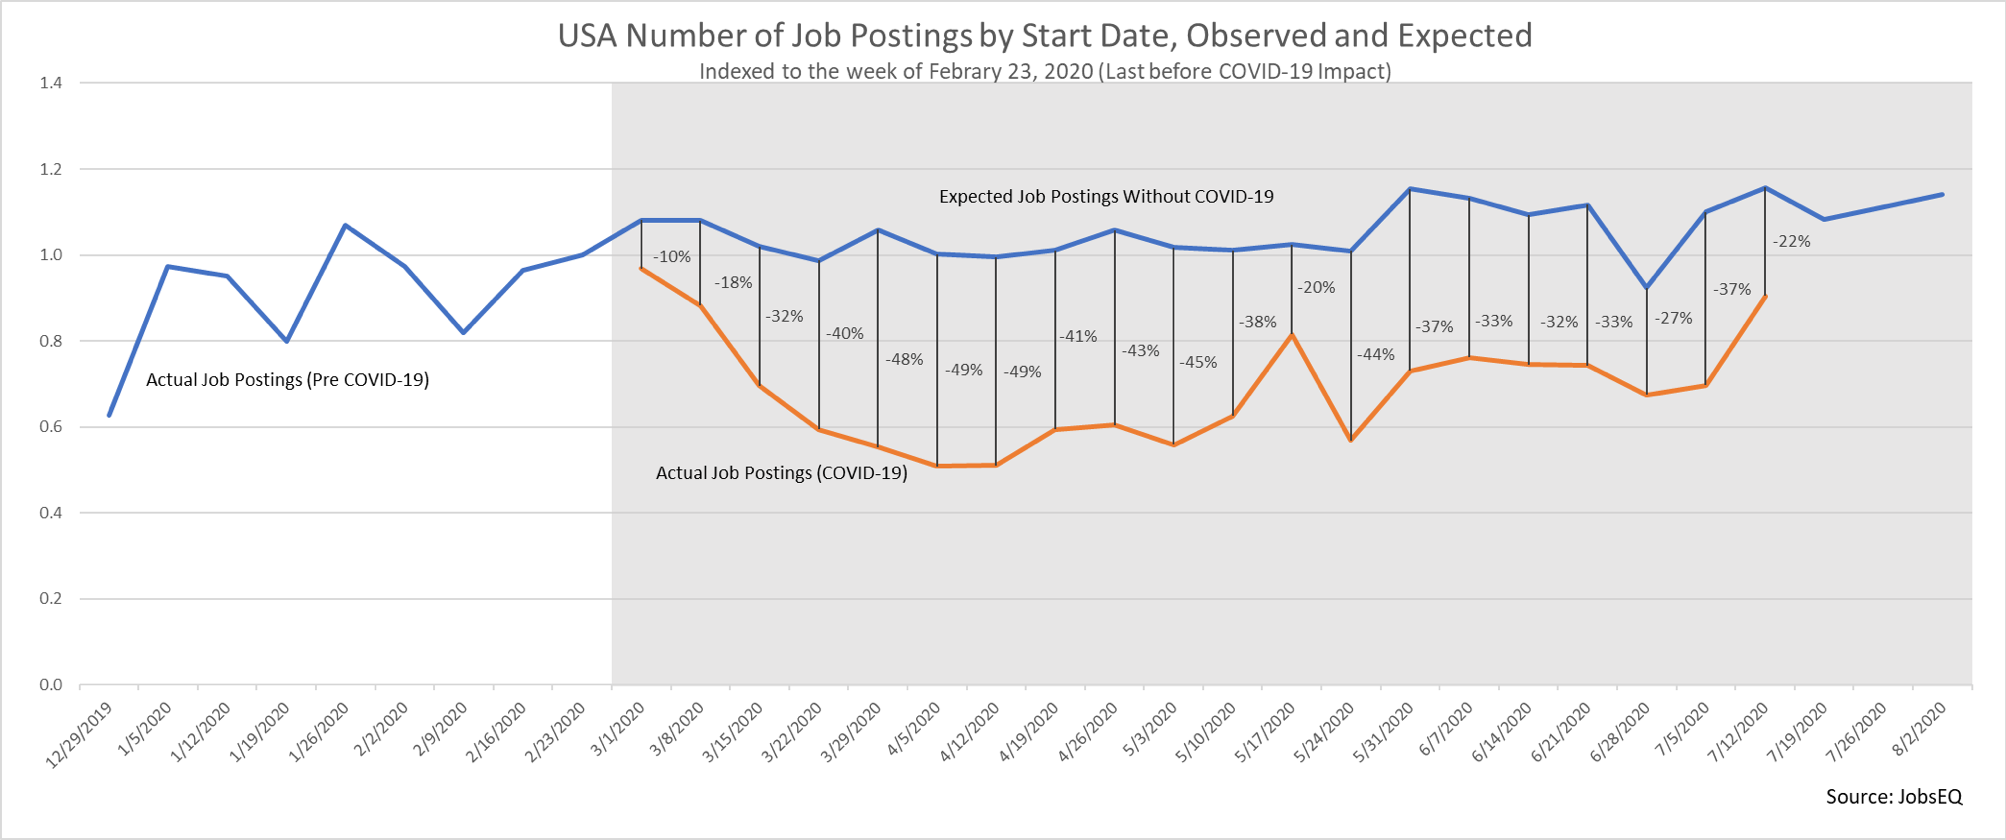
Chmura has been using our expected RTI volume model to help measure and track the impact of the COVID-19 pandemic on job postings. In our previous blog introducing this model, we noted that the recovery appeared to be well underway, with RTI relative volume increasing steadily from early April— when volume hit its lowest point—through the middle of May. Since then, however, the picture has changed. The chart below shows observed and expected RTI volume since the beginning of the pandemic.
Click on the picture to see a larger image.
The volume in early May recovered to 20% below expected volume on the week of May 17 (not as dramatic as initially appeared due to recent downward revision of the RTI data).[1] After reaching that relative peak, volume fell and remained mostly flat for six weeks, from the end of May through the beginning of July, averaging 33% below expected volume during that time. This period coincides with a shift in the coronavirus spread, where regions that were hit very hard early on, like New York, were improving but states in the deep South and West, including California, Florida, and Texas, began seeing a very rapid rise in cases.[2]
In the last week analyzed, the week beginning July 12, relative volume increased dramatically, reaching 22% below expected, up from 37% below the week prior. It is difficult to say what caused the increase yet, but early evidence suggests the increase may be related to the typical increase in volume seen following the Fourth of July holiday, rather than an indication of the recovery. In most years the increase in volume occurs in the week immediately following the holiday, but because the Fourth of July was on a Saturday this year it is speculated that more people extended their holiday into the following week, resulting in a lower increase the week after the holiday and then the much larger increase two weeks after the holiday.
Click on the picture to see a larger image.
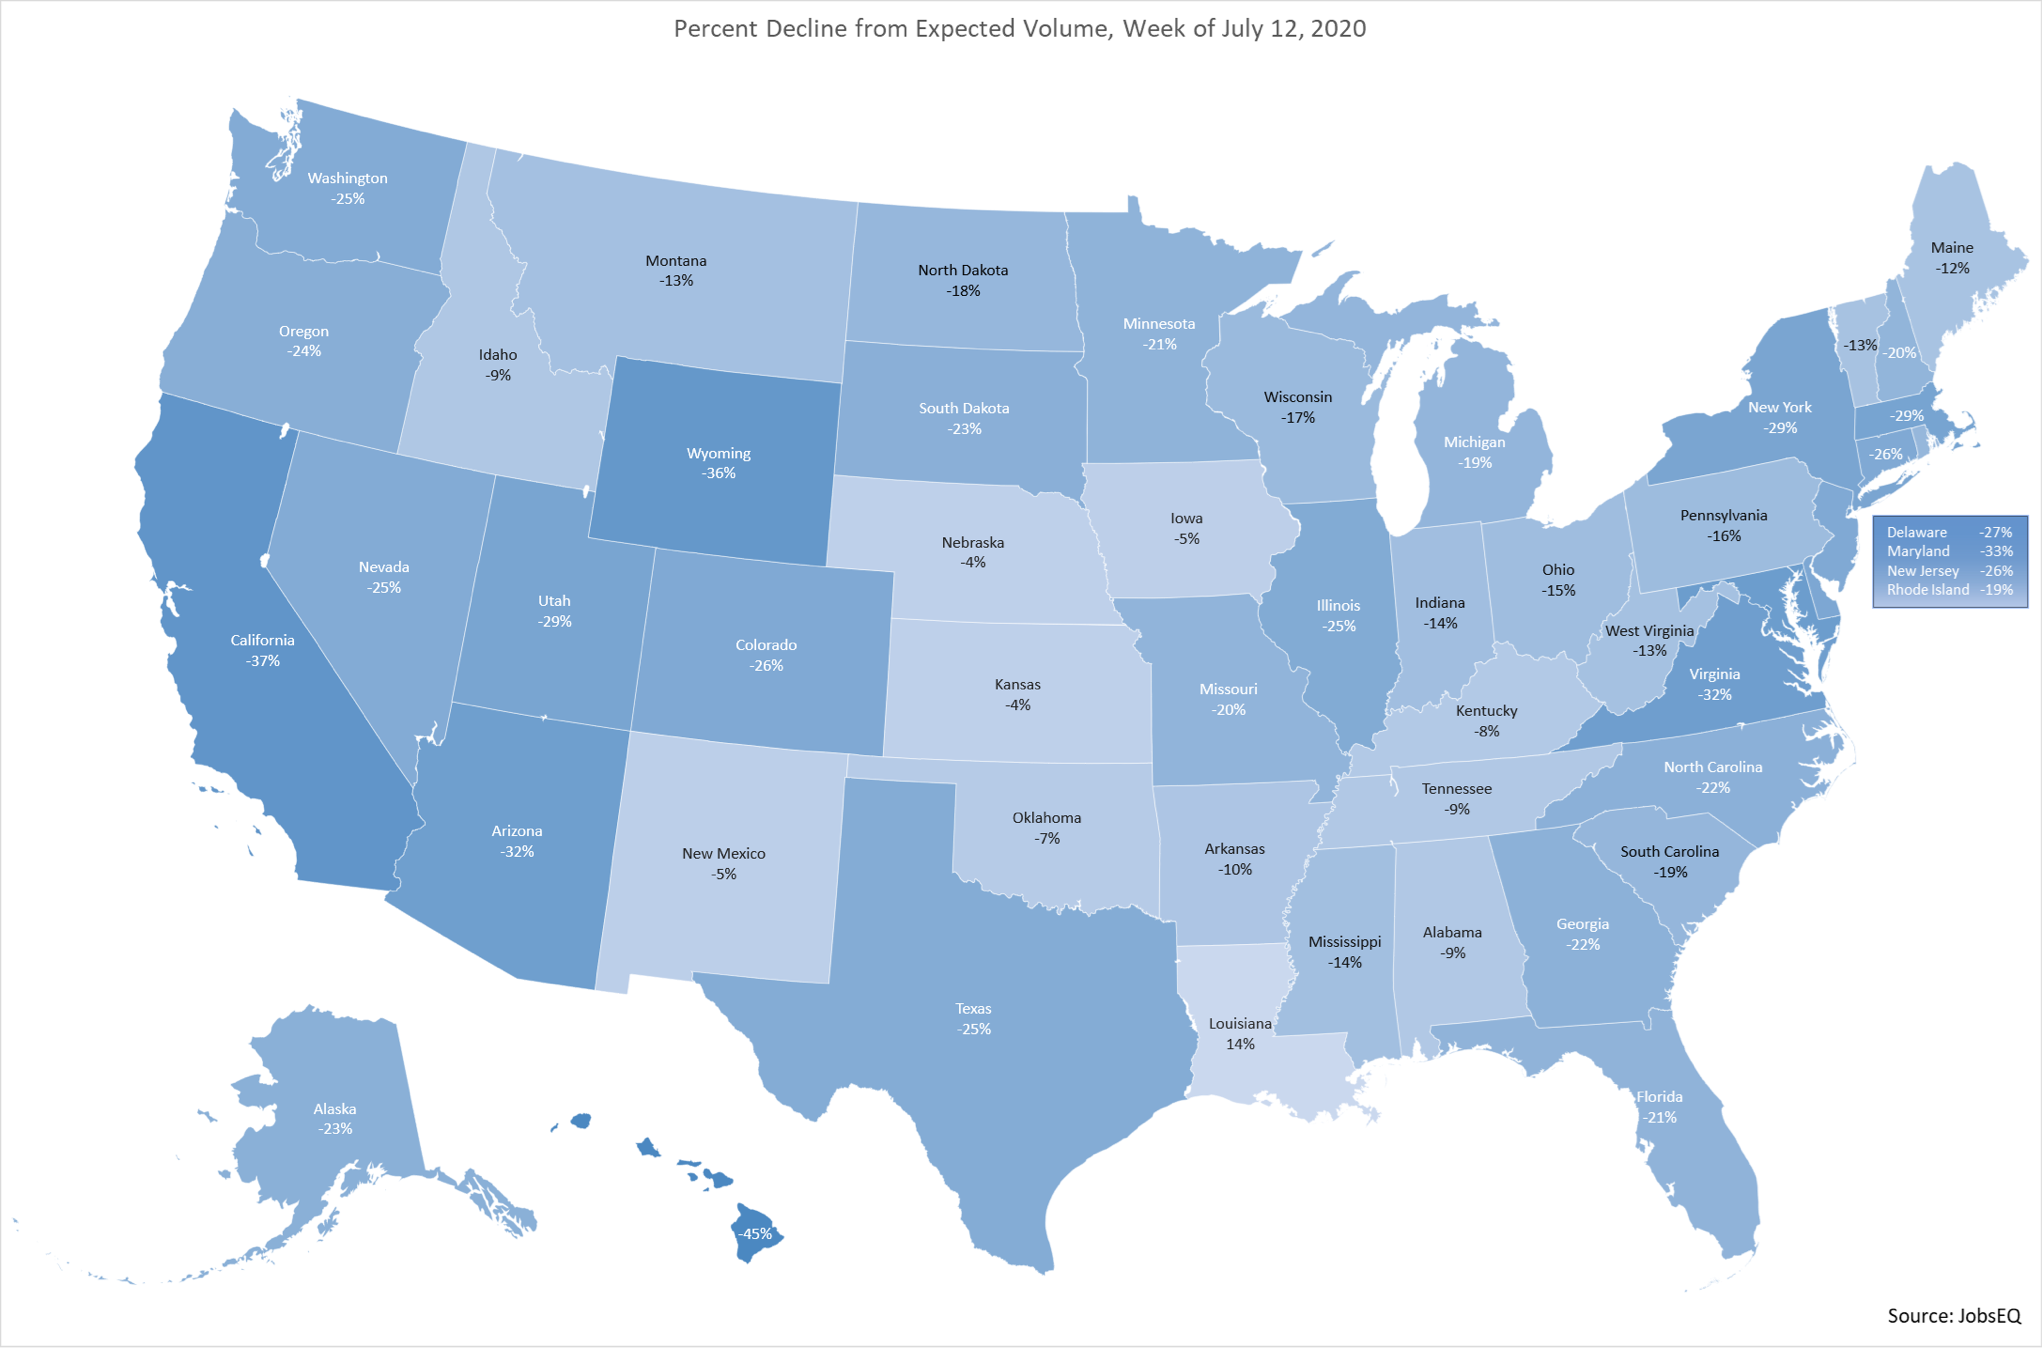
Above is a map showing the percent decline from expected volume for each state for the week of July 12. All states have improved compared to where they were early in the pandemic, but similar to the national level, the recovery appears to have paused recently. Three states—California, Delaware, and Arizona—have seen relative volume decline compared to where it was four weeks prior, on the week beginning June 14. Hawaii, with an economy heavily dependent on the tourism industry, remains the hardest hit with volume 45% below expected for the week beginning July 12.
Chmura will continue to monitor the impact of the COVID-19 pandemic. Be sure to check our blog for the latest updates.
[1] RTI data is updated daily and revisions of historical data are fairly common; these are typically small adjustments, however a recent revision resulted in a larger decrease in volume. Most of the impact was seen in July data, but there was some impact going back to the beginning of May, including a significant impact on the week of May 17, that lowered the volume from being 11% below expected volume, as seen in the previous blog, to 20% below expected volume after the revision.
[2] Per John Hopkins Coronavirus Resource Center https://coronavirus.jhu.edu/
Subscribe to the Weekly Economic Update
Subscribe to the Weekly Economic Update and get news delivered straight to your inbox.


