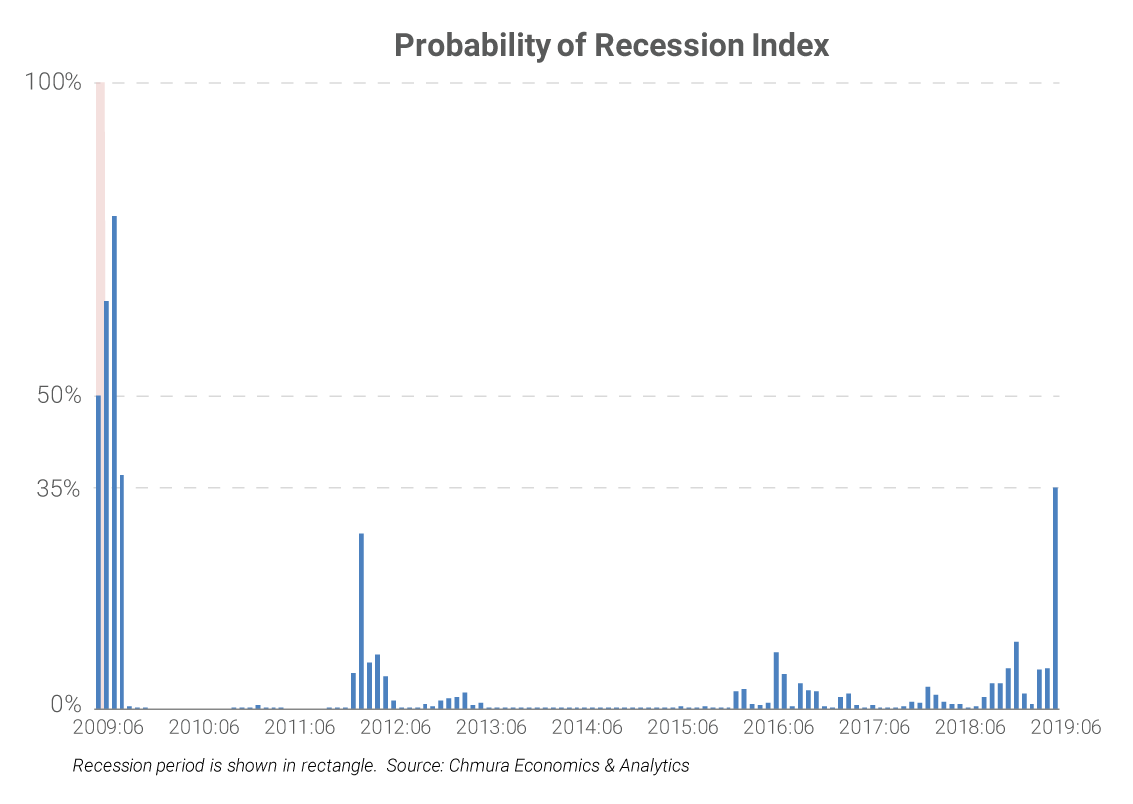
Chmura Recession Monitor Through June 2019: 35%

By Sharon Paulus |
The Chmura Recession Monitor is a monthly report published by Chmura Economics & Analytics.
Actual data through December 2018
Recession Probability through June 2019
Economic growth in the United States has generally been modest to moderate since the recovery began in the 3rd quarter of 2009. After increasing at a 4.2% annual rate in the 2nd quarter of 2018, real GDP rose at a 3.4% annual rate in the 3rd quarter as growth in consumer spending remained strong and a healthy contribution to growth from change in private inventories offset a subtraction from trade. Due to the 9.2% drop in the S&P 500 in December and the narrowing yield spread, the probability of recession jumped to 35% through June 2019. (1)

The table below provides monthly recession probability forecasts through June 2019.
| Calendar Date | Forecast Date | Probability of Recession |
Real GDP |
|---|---|---|---|
| Jan-18 | Jul-18 | 0 | 17:Q4: +2.3% |
| Feb-18 | Aug-18 | 0 | |
| Mar-18 | Sep-18 | 0.02 | |
| Apr-18 | Oct-18 | 0.04 | 18:Q1: +2.2% |
| May-18 | Nov-18 | 0.04 | |
| Jun-18 | Dec-18 | 0.07 | |
| Jul-18 | Jan-19 | 0.11 | 18:Q2: +4.2% |
| Aug-18 | Feb-19 | 0.03 | |
| Sep-18 | Mar-19 | 0.01 | |
| Oct-18 | Apr-19 | 0.06 | 18:Q3: +3.4% |
| Nov-18 | May-19 | 0.07 | |
| Dec-18 | Jun-19 | 0.35 |
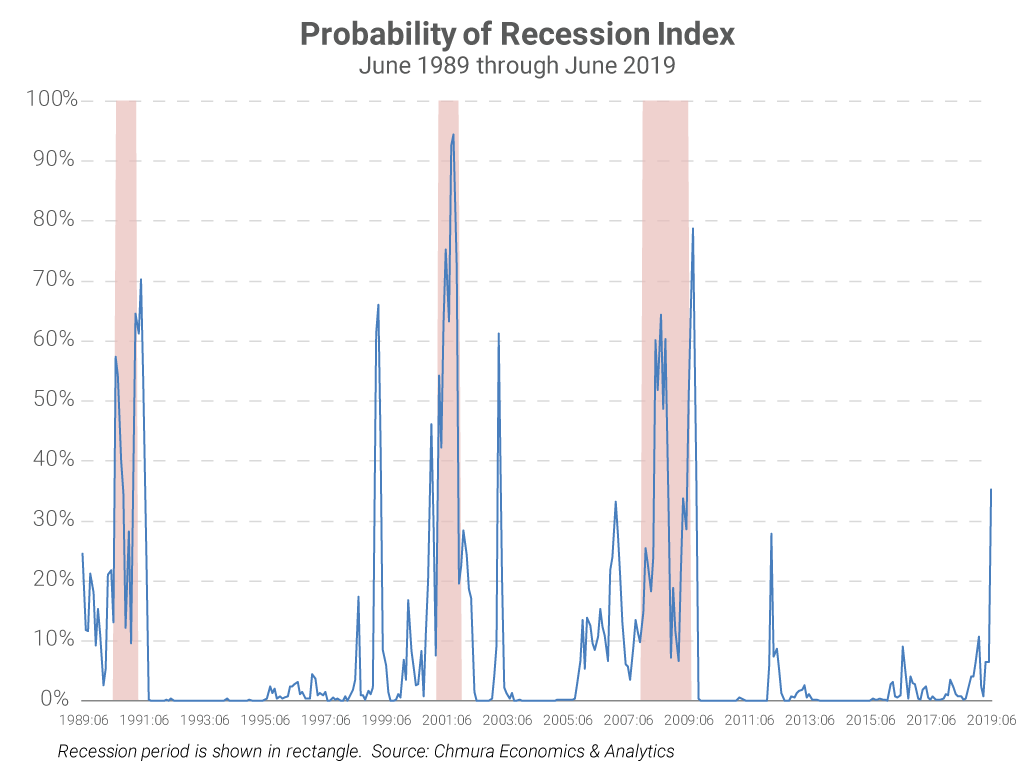
The above chart shows the success of this model at predicting the last three U.S. recessions. Official recession dates, established by the National Bureau of Economic Research, are represented by the shaded areas. The model uses the consumer price index, the spread of the Treasury curve, volatility in the Treasury curve, and the S&P 500 to predict when financial conditions are ideal for recession. A single month of elevated probability provides a warning that the economy is likely to slow. A sustained six-month period of greater than 50% probability establishes a clear sign that has historically been associated with recession.

(1) In the past, a 50% probability has been associated with a recession.
If you found this article useful, please share it on Twitter!
Subscribe to the Weekly Economic Update
Subscribe to the Weekly Economic Update and get news delivered straight to your inbox.