Why Economic Diversity Matters

By Chmura Economics & Analytics |
Though the economy has been booming and consumer confidence has hit an eighteen-year high,[1] the chances of a recession in the next two years is increasing according to Chmura’s economists. As such, economic developers may be asking themselves a tough question: “How well can my region withstand another economic recession?”
One aspect of the answer relates to economic diversity, the degree to which a region’s industry mix is broad-based. For example, a region that relies predominantly on oil production is less economically diverse than one that produces oil in addition to sporting a vibrant manufacturing and personal services sector.
Contact us now to learn more!
This indicator is important in gauging how flexible and stable an economy may be during a disruptive economic event. If oil prices plummet, the economy of a region tied only to oil production may stall, while an economy that has additional strong business sectors will likely be more resilient. This is why, in part, many "company towns" that rose in the late 19th and early 20th centuries fell quickly.[2] An economy that is diverse and supports a mix of industries are cushioned against volatility, as has been shown empirically.[3]
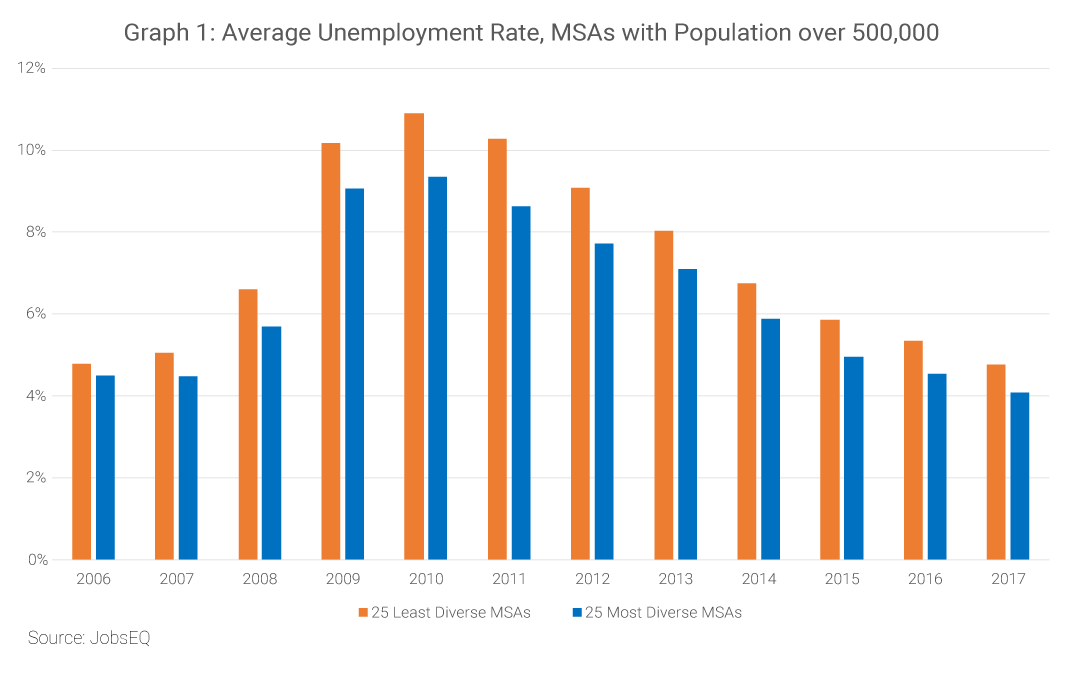
Moreover, economic diversity within a given county has been associated with lower levels of unemployment during and after the Great Recession.[4] Graph 1, for example, shows the differences between the average unemployment rates of the most and least diverse MSAs (metropolitan statistical areas) with population greater than 500,000. The group of metros with greater diversity averaged about a percentage point lower unemployment rates than the group with less economic diversity. The variation was most pronounced when overall unemployment was at its highest, between 2009 and 2012.
Economic developers can encourage diversification to create an ecosystem that buoys a wide array of economic activities, even during a downturn. Chmura’s Diversity Index shows how well every county and metropolitan area in the nation currently fares in terms of economic diversity. This index is made publicly available for community planners to utilize in their economic development decisions.
The following tables show the most and least economically diverse MSAs in the United States. Table 1 contains results for MSAs with population of half a million or more and Table 2 displays results for the MSAs with population under 500,000.
| 1 | Philadelphia-Camden-Wilmington, PA-NJ-DE-MD |
| 2 | Chicago-Naperville-Elgin, IL-IN-WI |
| 3 | St. Louis, MO-IL |
| 4 | Kansas City, MO-KS |
| 5 | Dallas-Fort Worth-Arlington, TX |
| 6 | Minneapolis-St. Paul-Bloomington, MN-WI |
| 7 | Atlanta-Sandy Springs-Roswell, GA |
| 8 | Tampa-St. Petersburg-Clearwater, FL |
| 9 | Phoenix-Mesa-Scottsdale, AZ |
| 10 | Cincinnati, OH-KY-IN |
| 98 | Palm Bay-Melbourne-Titusville, FL |
| 99 | Fresno, CA |
| 100 | Las Vegas-Henderson-Paradise, NV |
| 101 | Stockton-Lodi, CA |
| 102 | Modesto, CA |
| 103 | Durham-Chapel Hill, NC |
| 104 | Provo-Orem, UT |
| 105 | San Jose-Sunnyvale-Santa Clara, CA |
| 106 | McAllen-Edinburg-Mission, TX |
| 107 | Bakersfield, CA |
| Source: Chmura Economics & Analytics and JobsEQ. Data as of 2018 Q3. | |
| 1 | Springfield, MO |
| 2 | Roanoke, VA |
| 3 | Manchester-Nashua, NH |
| 4 | Pensacola-Ferry Pass-Brent, FL |
| 5 | Lubbock, TX |
| 6 | Fargo, ND-MN |
| 7 | Canton-Massillon, OH |
| 8 | Eugene, OR |
| 9 | Lincoln, NE |
| 10 | Mobile, AL |
| 265 | Ocean City, NJ |
| 266 | Merced, CA |
| 267 | Danville, IL |
| 268 | Columbus, IN |
| 269 | El Centro, CA |
| 270 | Dalton, GA |
| 271 | Hinesville, GA |
| 272 | Madera, CA |
| 273 | Elkhart-Goshen, IN |
| 274 | Hanford-Corcoran, CA |
| Source: Chmura Economics & Analytics and JobsEQ. Data as of 2018 Q3. | |
To clarify, even the MSAs with less diversity have a wide mix of industries, not being as one-dimensional as the aforementioned “company towns.” Furthermore, specialization in a certain industry does not preclude a region from having a robust, thriving economy. The Diversity Index, rather, is highlighting which regions have a wider array of industries.
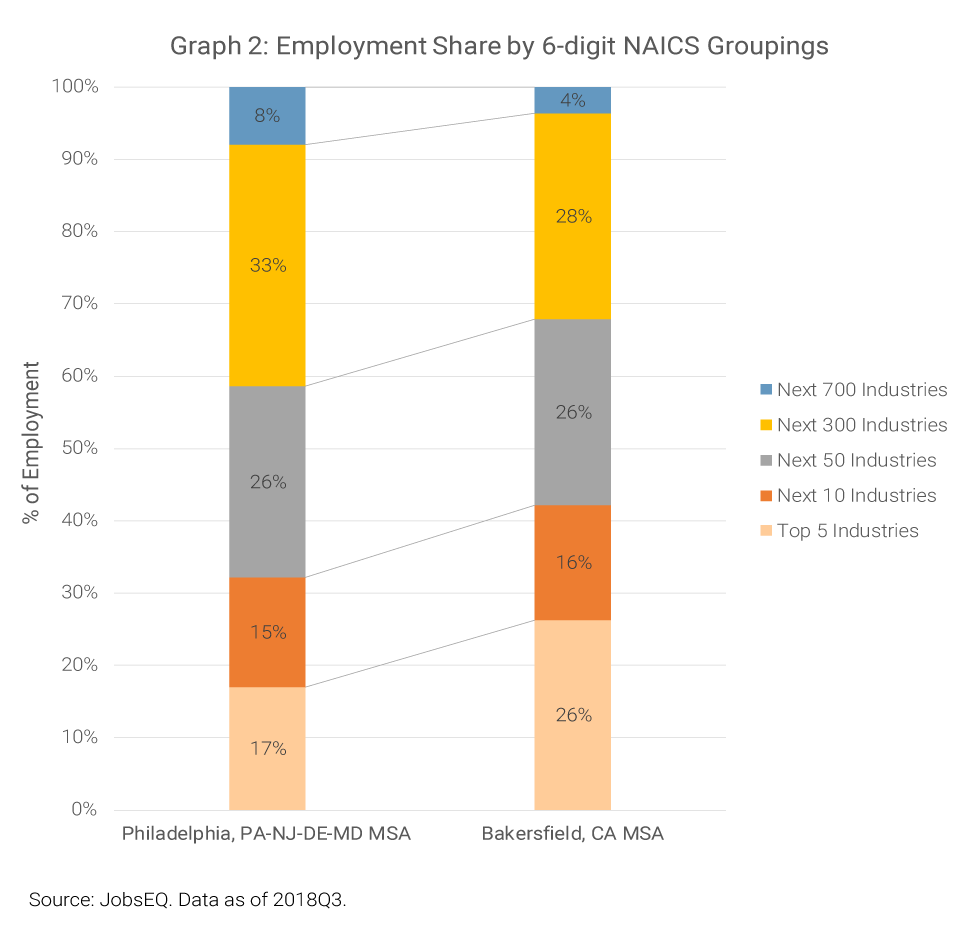
To illustrate this variation, Graph 2 shows the mix of industries within the Philadelphia and Bakersfield metropolitan areas, the most and least diverse of the MSAs with population over half a million. The five largest industries[5] in the Philadelphia MSA account for 17% of its total employment whereas the largest five in the Bakersfield MSA make up 26% of total employment there. In addition, the group of smallest industries account for more jobs in Philadelphia compared to Bakersfield. These factors contribute to the Philadelphia MSA having a higher diversity ranking.
To view a map of the Economic Diversity Index for all counties or MSAs in the United States, to download the full dataset, or to learn more about the methodology, please click here.
[1] CNBC. (2018). Consumer confidence rises to an 18-year high in October.
[2] Hirsch, M. (2015). America’s Company Towns, Then and Now.
[3] Malizia, E. E. and Ke, S. (1993), THE INFLUENCE OF ECONOMIC DIVERSITY ON UNEMPLOYMENT AND STABILITY. Journal of Regional Science, 33: 221-235. 10.1111/j.1467-9787.1993.tb00222.x
[4] Watson, Philip & Deller, Steven. (2017). Economic diversity, unemployment and the Great Recession. The Quarterly Review of Economics and Finance. 10.1016/j.qref.2016.12.003.
[5] “Industry” here refers to 6-digit NAICS industries with size based upon employment.
Subscribe to the Weekly Economic Update
Subscribe to the Weekly Economic Update and get news delivered straight to your inbox.


