Examining Industry Mobility for Occupations

By Sharon Paulus |
Industry mobility indicates the potential ease of switching industries based on an occupation’s employment share across industries. A mobile occupation is one in which workers can move from one industry to another with relative ease. This is important in designing training programs with skills needed across multiple industries as well as in the event of industry decline or a dislocation event. For example, almost 80% of electricians are employed in the construction sector. A downturn in construction is therefore likely to be a challenge for electricians because they may not be able to find a new job in another industry since such a large majority of employment opportunities for electricians are concentrated in the construction sector.
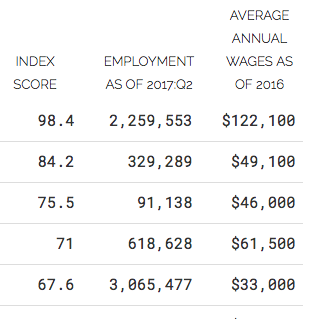
To measure an occupation’s industry mobility, Chmura calculated an index score based on occupation staffing data by industry.[1] A higher index score indicates an occupation is needed by many industries while a lower score suggests an occupation is employed by fewer industries and workers therefore have limited flexibility to change industries. The occupations with the highest industry mobility are shown in the table below.[2]
| Occupation | Index Score | Employment as of 2017:Q2 | Average Annual Wages as of 2016 | ||
|---|---|---|---|---|---|
| General and Operations Managers | 98.4 | 2,259,553 | $122,100 | ||
| Production, Planning, and Expediting Clerks | 84.2 | 329,289 | $49,100 | ||
| Maintenance Workers, Machinery | 75.5 | 91,138 | $46,000 | ||
| First-Line Supervisors of Production and Operating Workers | 71 | 618,628 | $61,500 | ||
| Office Clerks, General | 67.6 | 3,065,477 | $33,000 | ||
| Bookkeeping, Accounting, and Auditing Clerks | 66.9 | 1,725,464 | $40,200 | ||
| Purchasing Agents, Except Wholesale, Retail, and Farm Products | 61.5 | 303,628 | $67,400 | ||
| Industrial Production Managers | 60.1 | 172,970 | $107,100 | ||
| Shipping, Receiving, and Traffic Clerks | 52.7 | 691,606 | $33,200 | ||
| Administrative Services Managers | 49.5 | 273,864 | $98,900 | ||
| Source: Chmura Economics & Analytics and JobsEQ. | |||||
General and operations managers; production, planning, and expediting clerks; and machinery maintenance workers topped the list of most mobile occupations in the United States. General and operations managers plan, direct, or coordinate public or private-sector organizations’ operations. Almost every 4-digit NAICS level industry employs general and operations managers and at $122,100, average annual wages are well above the national average.[3] Production, planning, and expediting clerks coordinate and expedite the flow of work within or between departments based on the production schedule. About 92% of 4-digit NAICS level industries employ production, planning, and expediting clerks. Wages for production, planning, and expediting clerks are very close to the national average annual wage. The third most mobile occupation in the nation is machinery maintenance workers; they perform routine machinery maintenance including lubricating machinery and changing parts and are employed in almost three-quarters (74%) of industries at the 4-digit NAICS level. Average annual wages for machinery maintenance workers are slightly below the national average.
An occupation’s industry mobility depends in part on the location of employment. More specifically, an occupation in a rural area may be more or less mobile when compared with the same occupation in a non-rural area.[4] While there is significant overlap between the national top-10 list for most mobile occupations and the list for most-mobile occupations in rural areas, there are occupations where there is a considerable difference compared with the national mobility. Laborers and freight, stock, and material movers, hand, for example, is the 21st most mobile occupation in rural areas while being only the 107th most mobile occupation nationally. Security guards also enjoy relatively more mobility in rural areas; it is the 100th most mobile occupation in rural areas compared with the 544th most mobile occupation overall. In contrast, first-line supervisors of office and administrative support workers are more mobile at the national level than in rural areas (12th most mobile occupation in the nation compared with the 48th most mobile occupation in rural areas).
| Occupation | USA | Rural | |||
|---|---|---|---|---|---|
| Purchasing Managers | 26.2 | 55.1 | |||
| Production Workers, All Other | 7.3 | 33.0 | |||
| Laborers and Freight, Stock, and Material Movers, Hand | 15.8 | 34.6 | |||
| Human Resources Specialists | 22.1 | 39.5 | |||
| Advertising and Promotions Managers | 6.7 | 23.7 | |||
| Technical Writers | 15.9 | 30.0 | |||
| Drafters, All Other | 9.9 | 23.8 | |||
| Materials Scientists | 8.8 | 22.1 | |||
| Marketing Managers | 23.7 | 36.9 | |||
| Security Guards | 2.8 | 15.7 | |||
| Source: Chmura Economics & Analytics, JobsEQ, and the U.S. Department of Agriculture Economic Research Service | |||||
[1] Data as of 2017 Q2. Source: JobsEQ®
[2] Occupations are at the detailed (i.e., 6-digit Standard Occupational Classification) level.
[3] The North American Industry Classification System (NAICS) is the standard used by federal statistical agencies in classifying business establishments for the purpose of collecting, analyzing, and publishing statistical data related to the U.S. business economy.
[4] Rural areas were identified using the United States Department of Agriculture, Economic Research Service’s Rural-Urban Continuum Codes.
Subscribe to the Weekly Economic Update
Subscribe to the Weekly Economic Update and get news delivered straight to your inbox.