Our Most Popular Blogs of 2017
By Patrick Clapp |
This year on our blog we dug into applications of real-time intelligence data, explained changes to classification systems and forecasts, peeked behind how JobsEQ handles certain calculations and data, and a lot more. As we look forward to all the new content to come in 2018, here are our most popular blog posts from this year. In honor of counting down the new year, the top ten posts are sorted from least to most read.
10. Math Majors Solve Employers Problems
With students packing up to go back to college in August with declared or undeclared majors, it was a good time to consider the fields that graduating students are going into and whether they match up with the skills businesses need. We do the math on computer science degrees and quantitative skills.
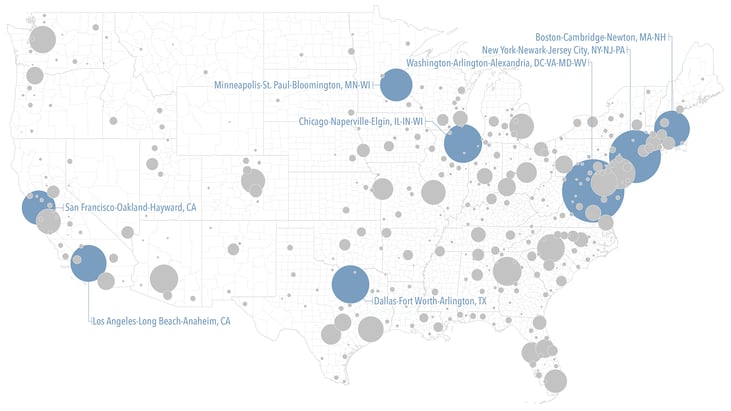
| Location | Post Count |
|---|---|
| New York-Newark-Jersey City, NY-NJ-PA MSA | 47,417 |
| Washington-Arlington-Alexandria, DC-VA-MD-WV MSA | 46,526 |
| San Francisco-Oakland-Hayward, CA MSA | 25,394 |
| Los Angeles-Long Beach-Anaheim, CA MSA | 25,082 |
| Chicago-Naperville-Elgin, IL-IN-WI MSA | 23,777 |
| Dallas-Fort Worth-Arlington, TX MSA | 22,337 |
| San Jose-Sunnyvale-Santa Clara, CA MSA | 20,602 |
| Boston-Cambridge-Newton, MA-NH MSA | 20,513 |
| Seattle-Tacoma-Bellevue, WA MSA | 18,505 |
| Philadelphia-Camden-Wilmington, PA-NJ-DE-MD MSA | 16,450 |
| Source: JobsEQ® Online postings for the 30-day period preceding 08/07/2017 | |
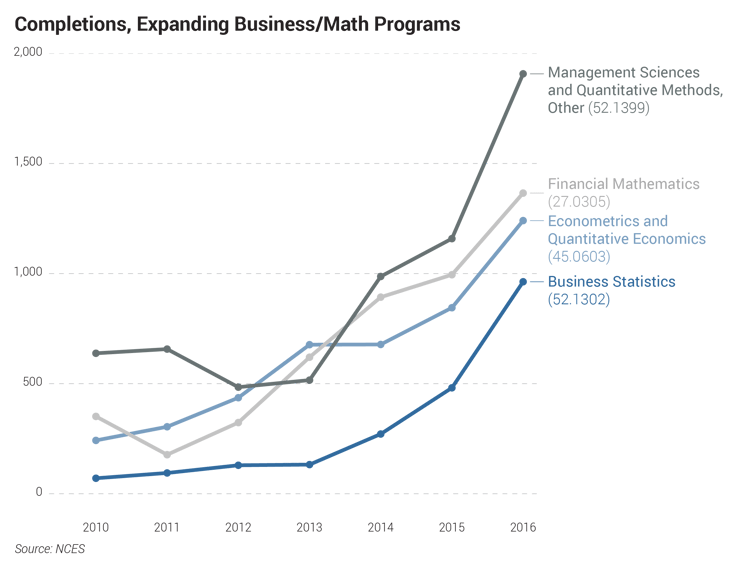
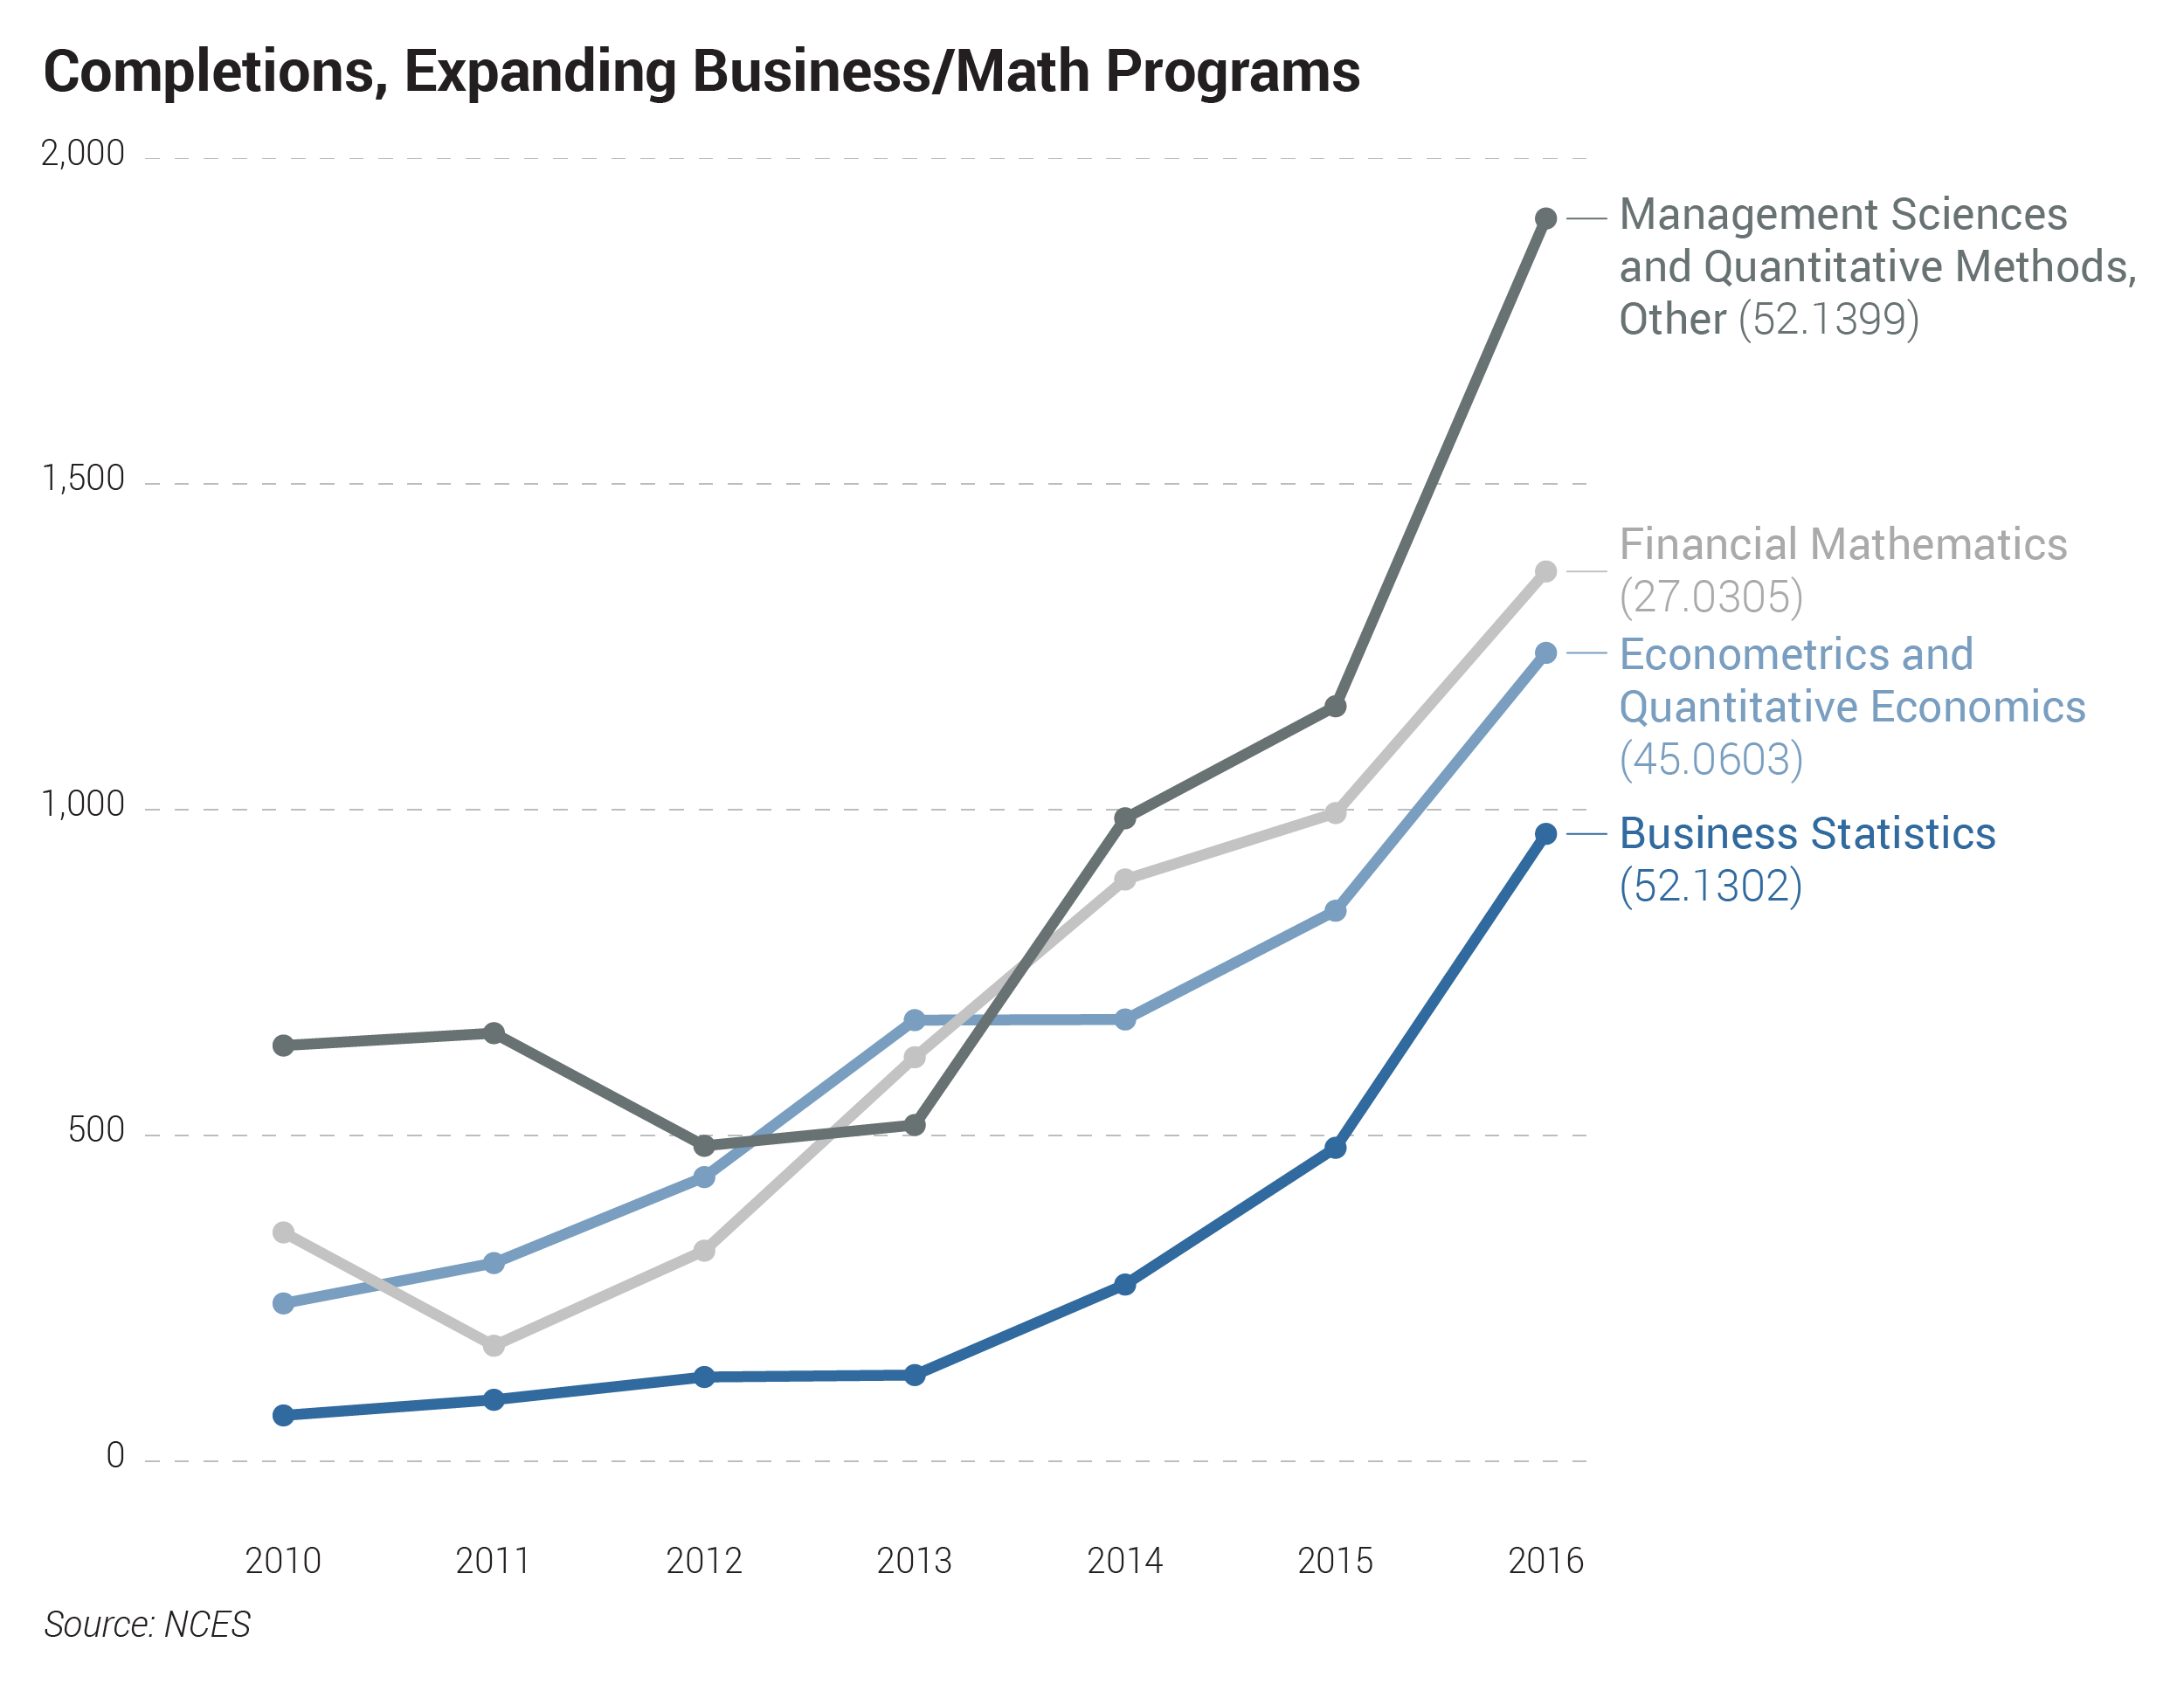
9. Trends in Postsecondary Completions: The 2016 NCES Data Release
In July, the National Center for Education Statistics released preliminary completions data for U.S. postsecondary schools for the 2015-16 academic year. In this blog, we highlight some of the trends in these data.
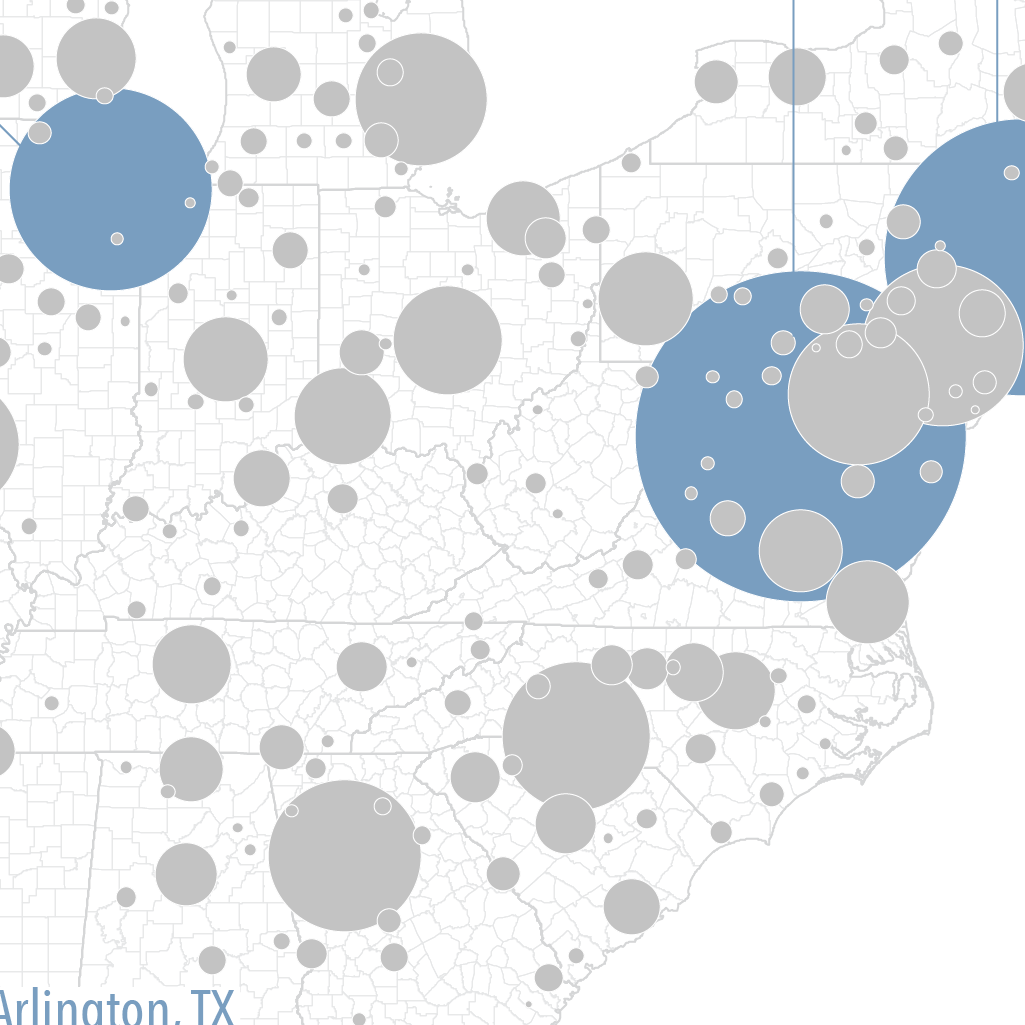
8. Using Job Postings to Visualize the Employment Impact of Hurricane Harvey
2017 has been a very active hurricane season. Some analysts argue Hurricane Harvey will be one of the most costly natural disasters in history. In this article, we examine the potential impact of Hurricane Harvey on employment in the Houston, Texas, region by using daily job postings data.
7. Manufacturing industry still challenged but the sector has changed
Manufacturing often gets a bad rap. That’s probably because the sector has declined by more than 4.9 million jobs since January 2000. The industry also has perception issues. Who wants to work in a dirty old factory with oil on the floor and dust in the air? But the manufacturing industry has changed — it is more high tech and offers better wages, making for a good career choice.
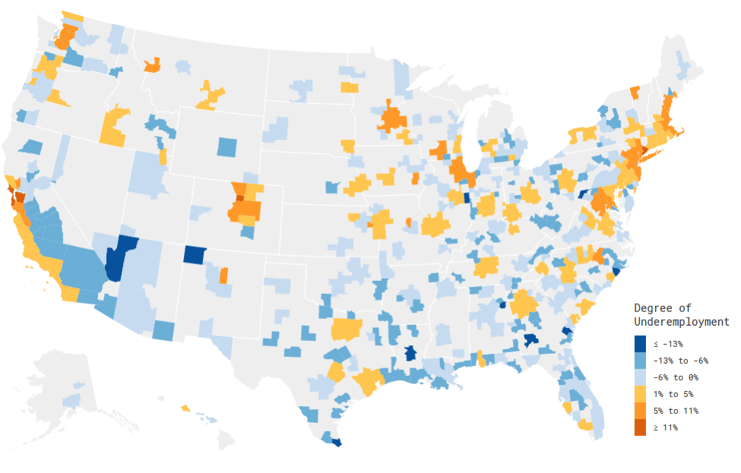
6. Underemployment in the United States
According to a 2015 Federal Reserve Bank of New York Staff Report, almost one-half (46%) of recent college graduates were underemployed in 2014. The so-called underemployed workers are employed in an occupation below their level of qualification—for example, a graduate with a Bachelor’s Degree in economics who is waiting tables or working at a retail store is considered underemployed. Chmura calculates a proxy for underemployment by comparing educational attainment supply and demand in a given labor market at various skill levels.
5. A Case Study in Labor Market Analytics
How would you handle a request from your boss asking whether you’ll be able to continue to attract the right talent needed for your current business operations? With information from JobsEQ in hand, an expansion decision can be made with more confidence.
4. Changes in Labor Statistics Signal Major Occupational Shifts and Impact to Higher Education Credentials
A joint research report by UPCEA and Chmura Economics & Analytics reveals a number of major occupational shifts in technology, healthcare, and other industries and their impact on higher education. The study, Occupational Shifts and Higher Education Credentials found a rise in alternative credentialing in the form of certificates, short-term courses, licensing, badges and micro-credentials among adult learners as well as traditional students.
3. Help Wanted: Applications Software Developers, Anywhere, USA
Odds are, many of us live in a region where it is difficult to find qualified developers. Using our JobsEQ® technology platform alongside our newly unveiled Real Time Intelligence (RTI) tool, Chmura made several “top ten lists” pertaining to application software developers in regional labor markets across the United States.
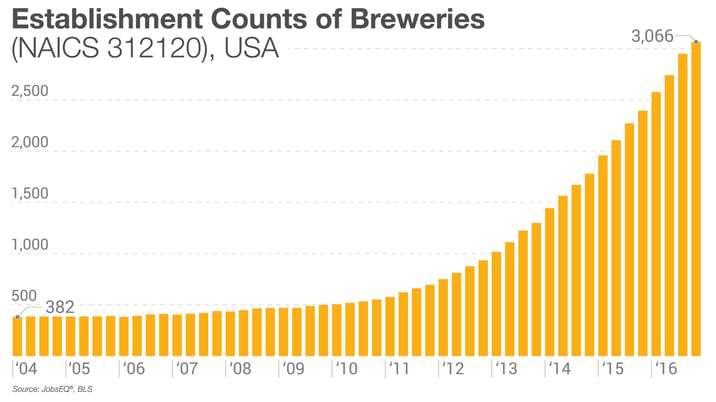
2. Job Growth in Manufacturing
While the U.S. manufacturing sector employed about 1.8 million fewer workers in 2016 compared to ten years prior, many industries within the sector have posted solid to robust job gains.
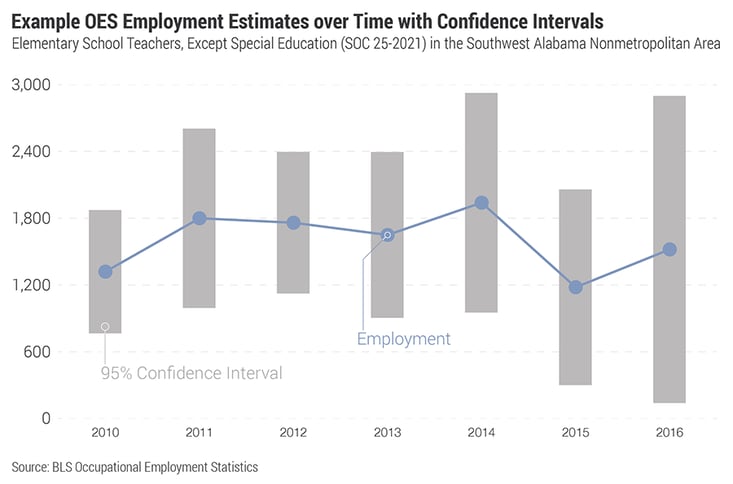
1. Regional Occupation Employment
A good estimate of occupation employment at the local geographic level is a critical piece of labor data. How is such an estimate made in JobsEQ, and what are the advantages of using these data in comparison to retrieving an occupation estimate straight from the Bureau of Labor Statistics?
Subscribe to the Weekly Economic Update
Subscribe to the Weekly Economic Update and get news delivered straight to your inbox.

