Hollowing Out of the Middle Class?

By Chris Chmura |
We’ve heard a lot about the hollowing out of the middle class. That is, a trend of solid job growth for middle-class Americans which turned into contraction during the Great Recession. This contraction persisted after the recession ended as more of the jobs held by the middle class moved offshore, were consolidated into fewer jobs, or were lost to productivity gains resulting from technology and innovation.
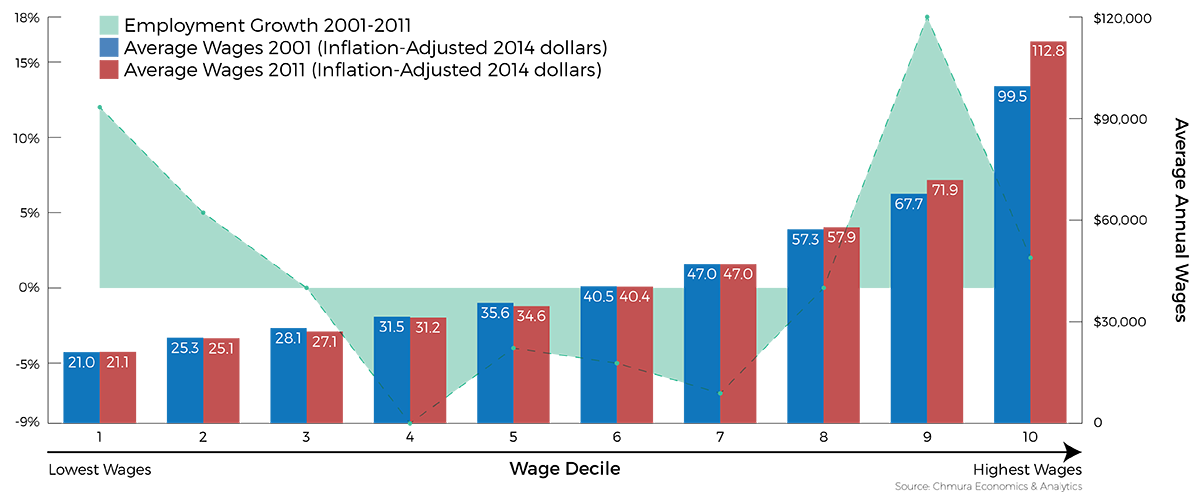
Was this hollowing out driven by the recession or is it indicative of a new norm? Chmura economists looked at this issue in 2013 and verified a clear hollowing out of the middle class, as shown in the chart below.[1] During the period from 2001 through 2011, wages were mostly stagnant, with gains exceeding inflation for only those occupations on the high end of the wage scale. Also, job growth was mainly isolated to those jobs paying the least and those paying the most (see our related post Where the Jobs Are for more).

Now, with data available through 2014 and three additional years’ distance from the end of the recession, are the jobs in the middle faring any better?
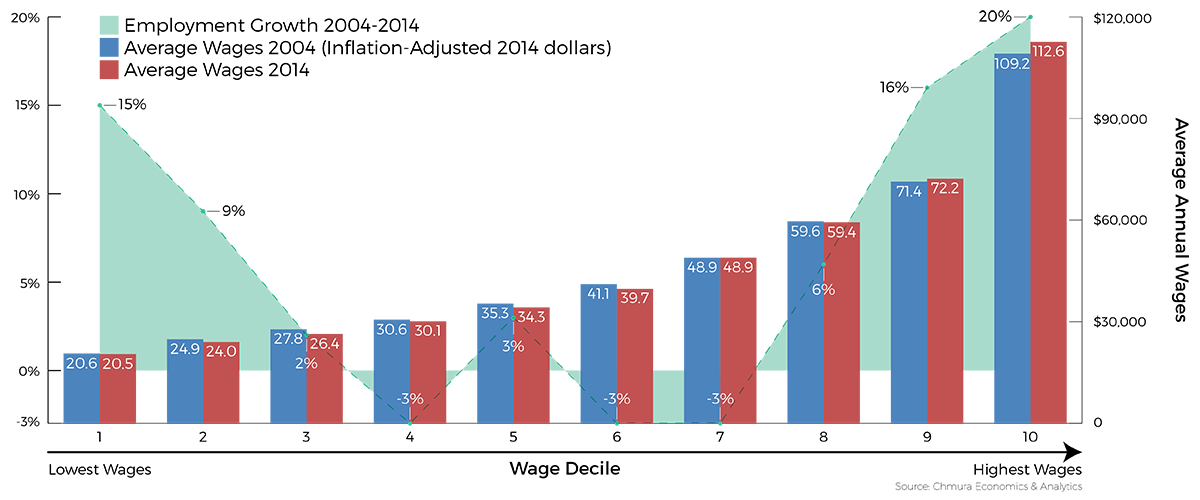
Using the same methodology as in 2013, the results demonstrate a continuation of the trends identified in the 2011 data with modest improvement. Wages grew slower than the pace of inflation for all but the 7th, 9th and 10th deciles, with deciles 2, 3, and 6 showing the slowest growth. Specifically, inflation-adjusted wages declined 3.5%, 5.0%, and 3.3% in deciles 2, 3, and 6, respectively. Similar to our findings in 2013, job growth has been the fastest in the 10th, 9th, and 1st deciles. Also, the middle class—represented by deciles 4, 6, and 7—showed negative job growth between 2004 and 2014, albeit relatively smaller declines than reported in the previous blog.

On a more positive note, employment grew in the 5th decile, which includes occupations such as dental assistants, medical secretaries, and customer service representatives. In addition, employment grew in a number of middle class occupations between 2004 and 2014, and many are expected to continue to grow, as demonstrated in the sample selection of occupations in the table below.
| Avg Ann Empl Growth 2004-2014 |
Forecast Avg Ann Empl Growth 2014-2024 |
Decile | |
|---|---|---|---|
| Interpreters and Translators | 7% | 4% | 7 |
| Health Technologists and Technicians, All Other | 7% | 2% | 7 |
| Medical Equipment Repairers | 6% | 3% | 7 |
| Insulation Workers, Mechanical | 5% | 4% | 7 |
| Occupational Therapy Aides | 5% | 3% | 4 |
| Medical Assistants | 4% | 3% | 4 |
| Industrial Machinery Mechanics | 4% | 2% | 7 |
| Computer User Support Specialists | 4% | 1% | 7 |
| Pharmacy Technicians | 4% | 2% | 4 |
| Physical Therapist Assistants | 3% | 3% | 7 |
| Medical Appliance Technicians | 3% | 1% | 6 |
| Machinists | 1% | 1% | 6 |
| Source: Chmura Economics & Analytics and JobsEQ® | |||
Growth in high-demand occupations such as these may lead to more competitive wages for the middle-deciles that could reverse current trends. For now, the data help explain the frustration that many have felt towards slow job recovery and wage growth post-recession. Stagnant wages have not been limited to the middle; spending power declined for seven of the ten deciles. Meanwhile, the middle-wage deciles in this analysis accounted for more than 40% of all jobs where job growth has been slow, at best, for those workers over the past decade.
Research assistance for this post was provided by Johnny Constable, Claire Brunner, and Leah Deskins.
[1] This analysis was created by using over 800 occupations identified by the Bureau of Labor Statistics. We broke the occupations into ten groups based on employment and wages earned and analyzed each deciles based on job and wage growth.
Subscribe to the Weekly Economic Update
Subscribe to the Weekly Economic Update and get news delivered straight to your inbox.