More and more over the past year, as companies have begun researching expansion initiatives or re-shoring opportunities, Chmura has been asked to provide guidance as to the availability and cost effectiveness of workers in a given area. Many times these industry executives or their site selection consultants have asked Chmura not only to assess the current supply and cost of qualified workers—a task readily accomplished via several analytics in JobsEQ®—but also to compare regions across the country in terms of potential wage pressure by industry or occupation. Companies want to know that they are expanding or relocating into an area with ample supply of qualified workers, but are wary of markets where they could face rapidly increasing labor costs.
Chmura’s economists responded to these requests by utilizing several proprietary features of JobsEQ® to create a wage pressure index that can provide an indicator between two cities or regions, indicating which is likely to experience faster wage growth in a given occupation over the next 2-4 years. Chmura’s wage pressure index combines actual 5-year (historic) wage growth in an occupation or industry with an imputation of the unemployment rate for an occupation (or group of occupations if we are estimating the wage pressure for an industry). These two factors are combined with long-term projections regarding the expected surplus or deficit of a given occupation (or a group of occupations for an industry analysis) and the 10-year employment growth forecast for the city or region. Chmura’s economists then compared these four factors to a national level norm to provide a composite index that is a valid predictor of latent wage pressure in a given city or region for a specific occupation or industry.
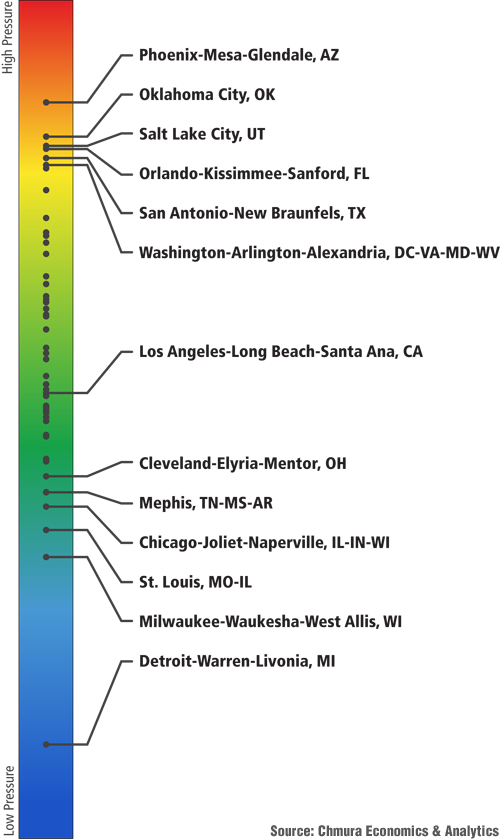
Currently, Chmura’s economists are computing the index on an ad-hoc basis for our clients while preparing the method for implementation into JobsEQ® by the end of 2012. To help illustrate the value of this analytic, we have calculated the wage pressure index for software application developers (SOC 15-1132) across the 50 largest US metropolitan statistical areas. The results are quite interesting. Several midwestern and southern MSAs score as having very low wage pressure while many western and southwestern metros, despite having relatively low wages for this position, are likely to see continued high wage appreciation over the next several years. Interestingly, most of the traditional IT hotspots in California and Boston score in the middle of the pack in terms of wage pressure. Texas metros run the gamut with Dallas being one of the MSAs with the lowest wage pressure and San Antonio being one of the highest, with Austin and Houston ranking in the middle. This is analysis is simply an example of the analytic and Chmura strongly feels that this tool is best used at the industry level or for a group of key occupations analyzed together—such as all IT jobs—in order to inform an actual expansion or relocation decision.

| MSA |
Wage Change |
Gap |
Growth |
Unempl |
| Phoenix-Mesa-Glendale, AZ MSA |
 |
 |
 |
 |
| Oklahoma City, OK MSA |
 |
 |
 |
 |
| Salt Lake City, UT MSA |
 |
 |
 |
 |
| Orlando-Kissimmee-Sanford, FL MSA |
 |
 |
 |
 |
| San Antonio-New Braunfels, TX MSA |
 |
 |
 |
 |
| Washington-Arlington-Alexandria, DC-VA-MD-WV MSA |
 |
 |
 |
 |
| ... |
| Los Angeles-Long Beach-Santa Ana, CA MSA |
 |
 |
 |
 |
| ... |
| Cleveland-Elyria-Mentor, OH MSA |
 |
 |
 |
 |
| Memphis, TN-MS-AR MSA |
 |
 |
 |
 |
| Chicago-Joliet-Naperville, IL-IN-WI MSA |
 |
 |
 |
 |
| St. Louis, MO-IL MSA |
 |
 |
 |
 |
| Milwaukee-Waukesha-West Allis, WI MSA |
 |
 |
 |
 |
| Detroit-Warren-Livonia, MI MSA |
 |
 |
 |
 |