Covid-19
RTI State Recovery Model
Using the full RTI dataset, Chmura has developed a model to predict what new RTI volume would be for each week of 2020 under a scenario where the...
As the COVID-19 pandemic has continued in the United States, Chmura has been tracking volume changes in its RTI job postings data . These data help...
As the COVID-19 pandemic has continued in the United States, Chmura has been tracking volume changes in its RTI job postings data. These data help measure the impact of the pandemic on the economy and job availability, along with the rate of recovery following widespread shutdowns in the spring.
To better measure both the impact and the recovery, we developed a model to predict what new RTI volume would be for each week of 2020 under a scenario where the COVID-19 pandemic had never occurred – what we call “expected volume.” By comparing observed volume to expected volume, we can better understand how much volume changes are directly related to the pandemic and recovery. For example, in a previous blog we noted that volume had finally reached pre-pandemic levels in August, however, those levels still remained below the volume we would expect for that time. In this blog we present a small adjustment to the model that helps control for some of the randomness in the data and provide an update on the recovery through mid-September. Finally, we introduce an expansion of the model and corresponding dataset: full state-level expected and observed job postings volume during the pandemic.
The expected volume model estimates new RTI volume. In other words, the number of jobs that are newly posted in each week. Inherently, there is some uncontrollable randomness involved in the timing of when a job posting goes online and becomes discoverable. A simple example of this is technology error – where a bug in some process creates a delay in when jobs are posted, potentially causing them to be posted a week or two later than originally intended. Other examples that can impact the timing are things such as company policy, workload of individuals involved in the job posting process, and unforeseen circumstances. This randomness is one of the contributing factors to volatility in new job postings volume.
Using the example of technology error, imagine that a large HR system – a company that provides job posting management software and services to businesses - encounters a system error that temporarily takes down all of their client’s job sites, preventing their new postings from going live on their job sites. This creates a temporary delay in job posting volume and once the issues is resolved it will result in a large spike in volume as all of those job postings go live at once, when in reality, they should have been more evenly spread over several days.
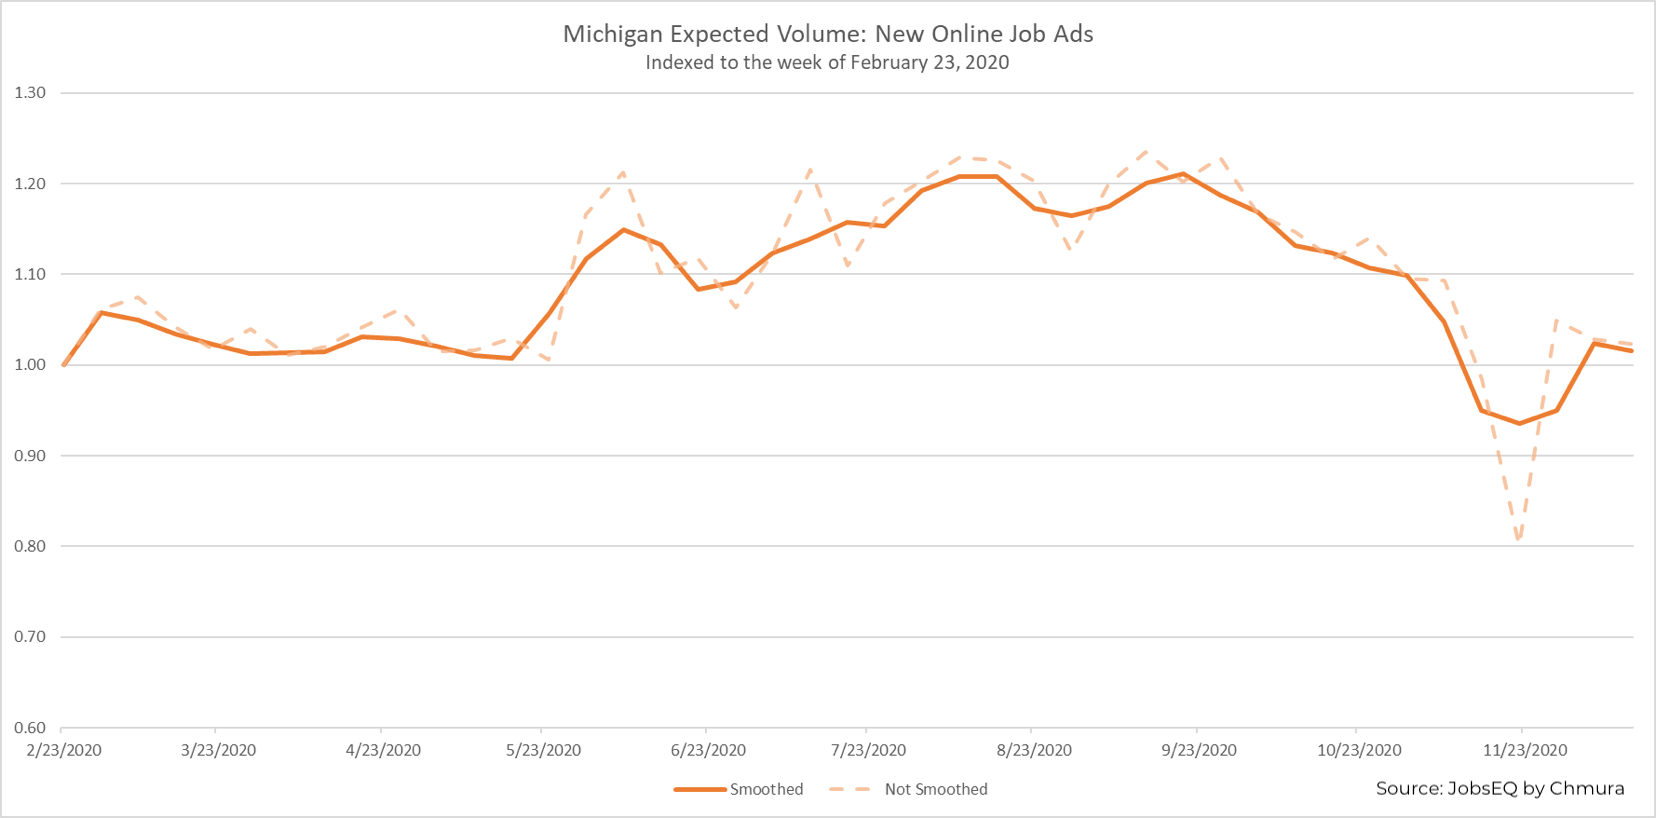
To help account for this randomness, our expected and observed volume now has a smoothing adjustment applied, where volume for a given week is now a three-week average – the average of one week prior, the week of, and one week following. The effect of the adjustment is small, but it helps to minimize spikes in the data, allowing for better visualization of trends. As an example, below is a chart showing expected volume for Michigan, both with and without the smoothing adjustment. While both lines are showing the same trends, it is easier to see the rate at which volume is expected to increase through the summer with the smoothing adjustment applied.
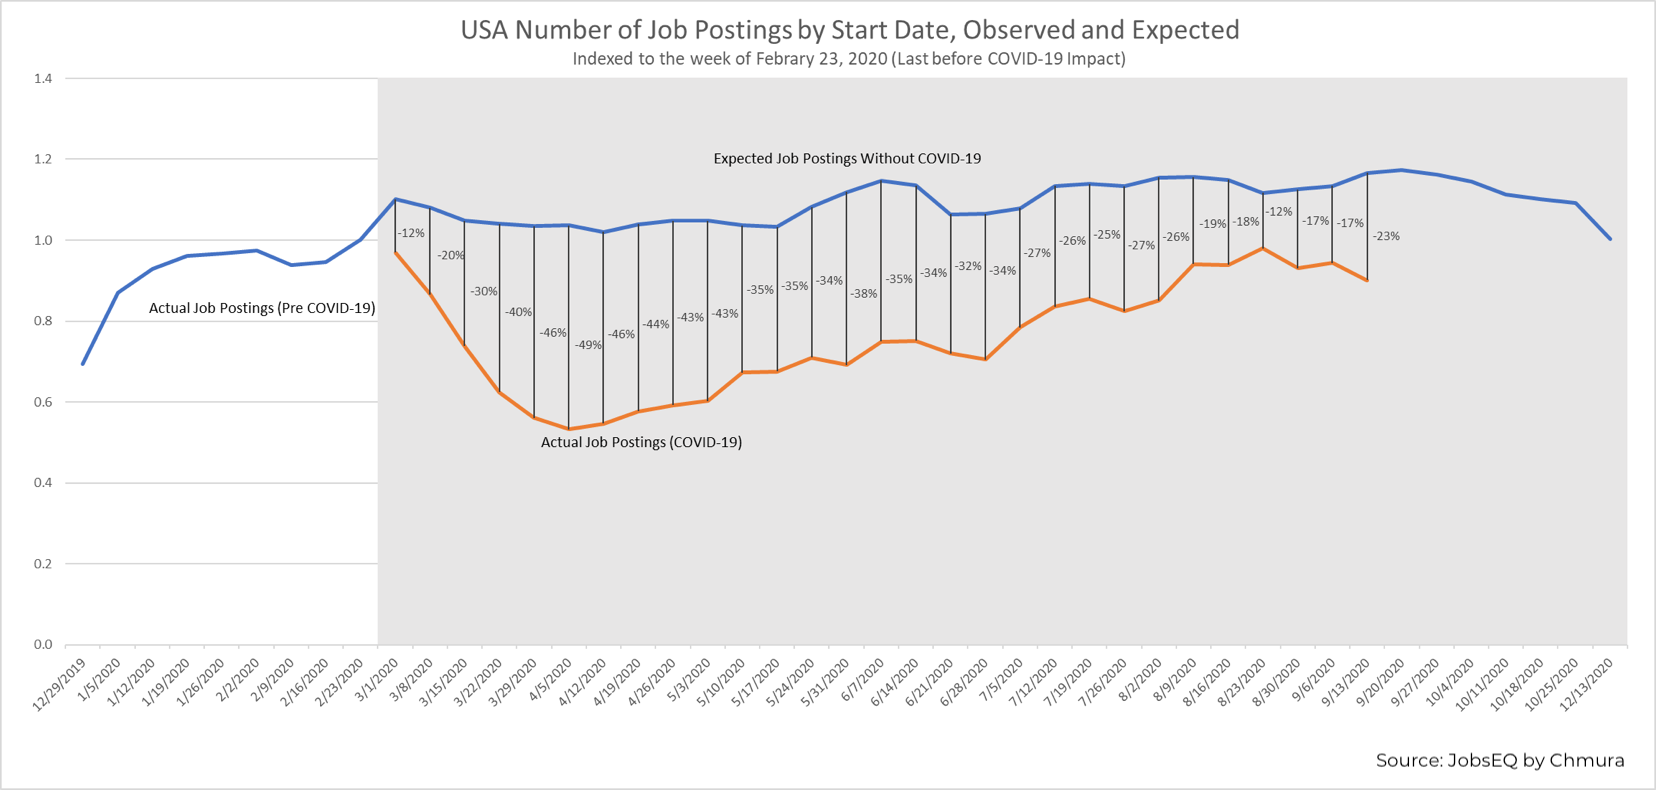
Since falling to a trough of 49% below expected volume on the week of April 5, national RTI volume has been steadily increasing throughout the spring and summer – reaching a peak of 12% below expected volume on the week of August 23. From April 5 to August 23, observed volume increased by an average of 3.2% per week, compared to an average weekly increase of 0.4% for expected volume, showing relatively steady progress in the recovery during the summer. Through the first three weeks of September, however, volume has begun declining again. This could be an indication of the recovery slowing, but it may also be an early start to the decline in volume that typically occurs in the fall.
At the state level, most states have followed some variation of the national trend, but Hawaii is especially interesting. We’ve mentioned Hawaii in a previous blog, highlighting the fact that its tourism-dependent economy has been heavily impacted by the pandemic and widescale shutdowns, resulting in one of the largest drops in volume of all the states. With this update, the extent of the impact is even more apparent.
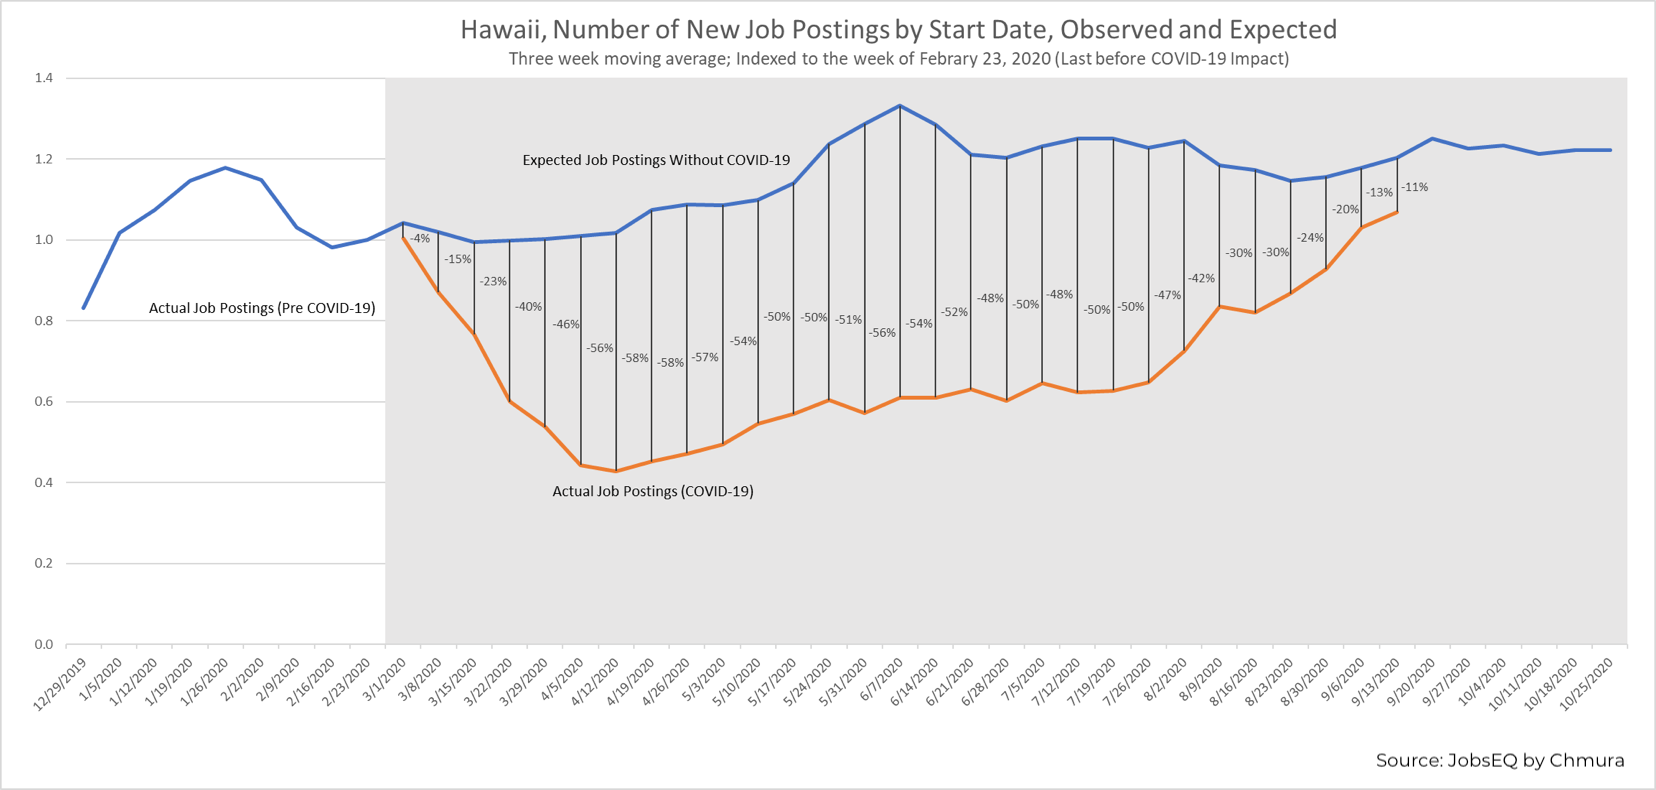
The chart above shows the observed and expected volume for Hawaii. Job posting volume in Hawaii fell to a low of 58% below expected volume early in the pandemic, and while it did recover somewhat during the spring, volume remained especially low throughout most of the summer. It did not consistently break 50% below expected volume until August. Being so heavily dependent on tourism, Hawaii’s hiring and job postings fluctuate greatly by season. In the months leading up to the summer, there is a large expected increase in job posting volume; between the weeks of March 1 and June 7, volume is expected to increase by about 28%. Because of the pandemic, Hawaii not only experienced the immediate drop in volume that was experienced nationwide; but it remained far below expected volume for so long because gains from the recovery were not enough to offset the expected increase in seasonal hiring. Conversely, as the seasonal boost ended in the latter portion of the summer, it allowed the recovery to gain more ground on expectations, increasing to only 11% below expected volume in the week of September 13, the last week of observed data.
Using the full RTI dataset, Chmura has developed a model to predict what new RTI volume would be for each week of 2020 under a scenario where the COVID-19 pandemic had never occurred – what we call "expected volume." By comparing observed volume to expected volume, we can better understand how much volume changes are directly related to the pandemic and recovery, allowing us to better track the recovery.
To help visitors better track the recovery in their own state, Chmura is making our expected volume data available through the two interactive graphics below. The first is a map that displays the percentage difference between expected volume and observed volume for every state on a specified week, with every week of the pandemic (week of March 1 through latest available data) being viewable. This allows you to easily compare the recovery in your state to other states in the nation. The second chart is a time series graph, plotting expected volume and observed volume for a specified state (or the United States) allowing you to track the recovery over time. Hover over either line in the chart to see the indexed expected volume, indexed observed volume, and the percentage difference between the two. Select a state on the map to see that state's time series chart or deselect all states to see the U.S. chart.
To learn more about the expected volume model, please read this blog:
COVID-19: Measuring the Impact on Job Postings During the Pandemic
Using the full RTI dataset, Chmura has developed a model to predict what new RTI volume would be for each week of 2020 under a scenario where the...
Chmura’s RTI Recovery Model and related data, available free to the public on our website, is designed to specifically measure the state of the...
We've updated our RTI State Recovery Model! This model compares weekly online job ad volume in the COVID environment against expectations if the...