Hiring demand—exemplified by new online job ad volume—continued its recovery through July but remained lower than pre-COVID levels, especially in certain occupation groups and areas of the country.

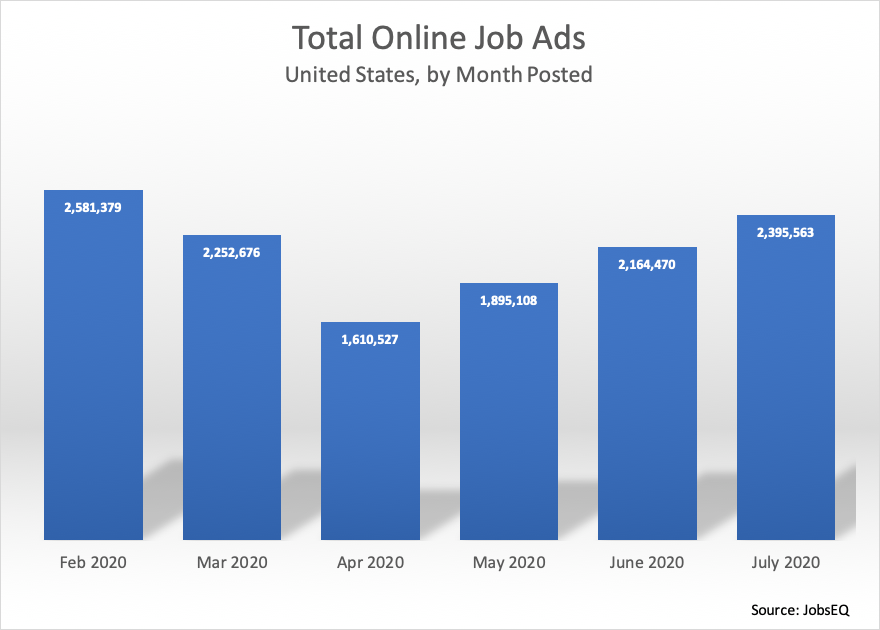
New online job ads reached approximately 2.40 million in July, up from 2.16 million in June. Volume was approximately 2.58 million in February before the economic shutdowns due to the coronavirus became widespread in the United States and sent new job ad volume to a trough in April.
Variation in Demand by Occupation

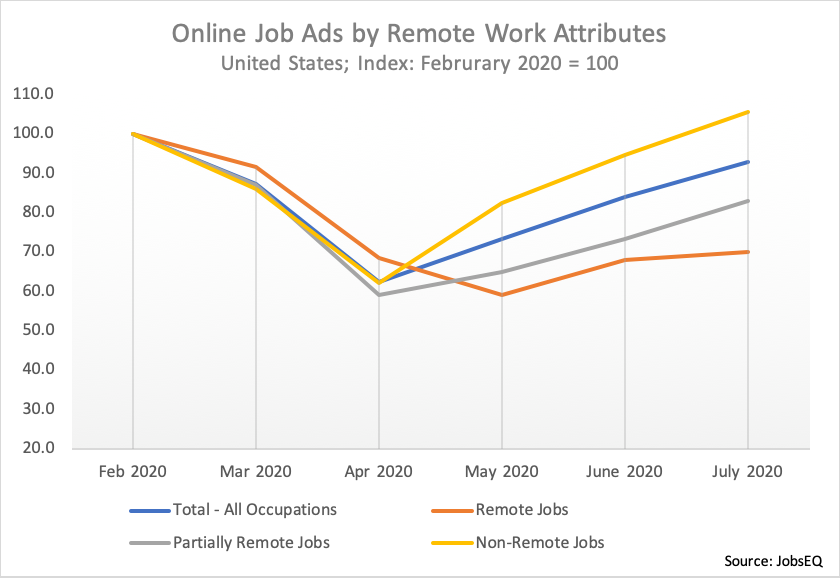
Occupations that typically can be performed remotely have been especially slow to recover. Remote job occupations fared better than average in the early months of the pandemic shutdown, but have since fared worse than average. In contrast, jobs that cannot be performed remotely[1] have collectively seen volume recover through July and eclipse pre-COVID levels.

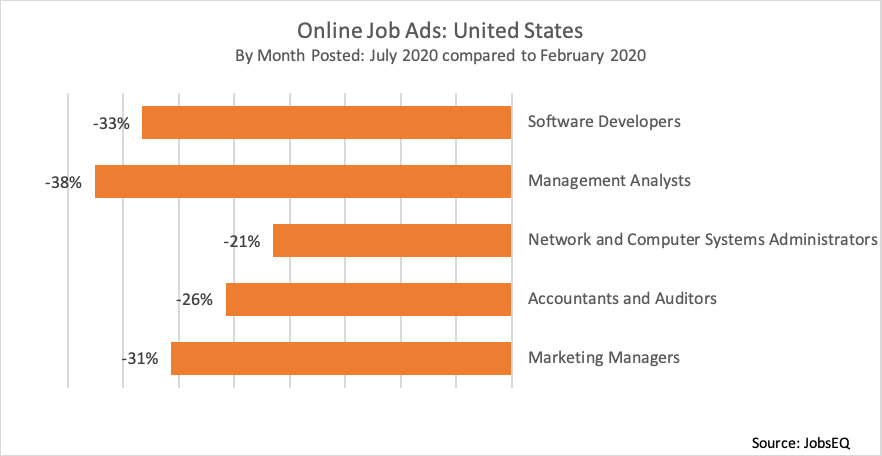
A selection of remote occupations are shown above, each recording a substantial decline in new job ad volume in July compared to pre-COVID levels in February. Changes vary from a 21% decline among network and computer administrators to a 38% decline among management analysts. This is especially noteworthy as these five occupations are all high-wage, high-demand occupations—defined as having above average wages[2] and above average long-term employment growth expectations.[3]
However, these occupations also are frequently employed in the professional and business services sector (PBS) which has recently seen weak demand.[4] For example, the Federal Reserve Bank of New York noted in July that PBS contacts in its region had reported price cuts and depressed activity as “many business customers have cut back on such services.” Further, the bank reported “widespread concern about when such business will rebound.”[5]
Variation in Demand by Location

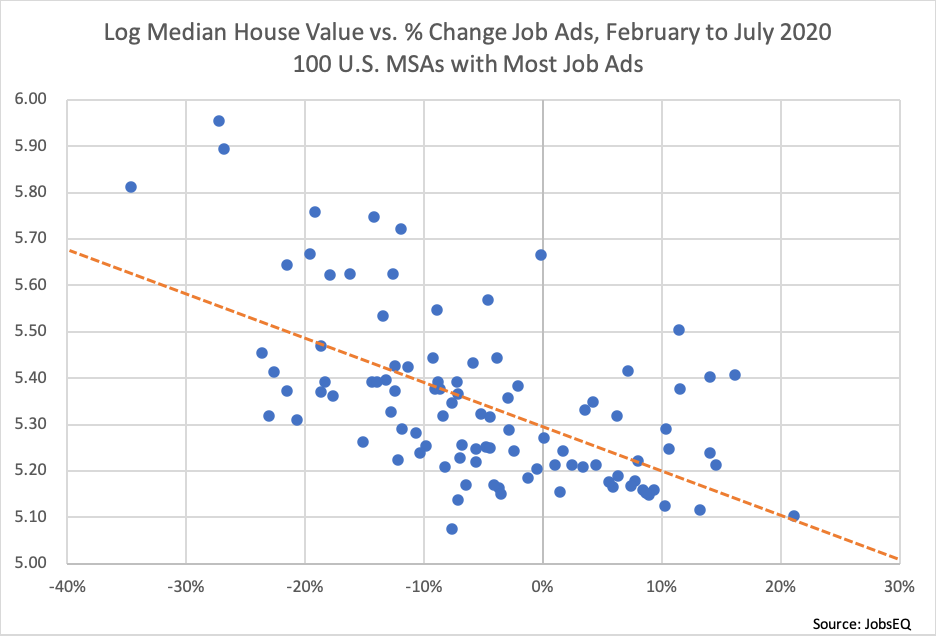
Interestingly, U.S. metropolitan areas with higher costs of living are more likely to be struggling with the post-COVID job recovery. Specifically, among the top 100 U.S. metros,[6] those with higher median home prices were more likely to have lower new online job ad volume in July as compared to pre-COVID levels in February. This effect held for jobs overall as well as for white collar jobs in particular. For example, from February to July, overall new job ad volume fell 27% in the San Francisco MSA, 22% in the Washington DC metro area, and 20% in the New York MSA.
Likely contributing to this relationship is the industry mix in these metropolitan areas. For example, many MSAs with higher home prices have larger concentrations of professional and business services as well as arts, entertainment, and recreation. As noted above, PBS is struggling of late. In addition, the arts, entertainment, and recreation sector was hit especially hard in the COVID lockdowns and is still hampered in recovering due to social distancing requirements.
On the other hand, metros with lower median home prices frequently have larger mixes in the sectors of utilities; manufacturing; and transportation and warehousing. These sectors have generally seen smaller than average job losses due to COVID.
About the Data
All data above are derived from JobsEQ, the Real-Time Intelligence online job ad data set, pulled from over 30,000 websites and updated daily. Historical volume is revised as additional data are made available and processed. Each month of ads is defined as new online ads that first appeared in that month. All ad counts represent deduplicated figures. The relationship between ad counts and actual hires is described here.
Many extraneous factors can affect short-term volume of online job postings. Thus, while the changes noted above should be watched over time to confirm the impacts, such a short-term snapshot can offer an early indication of labor market shifts, especially valuable in this time of unprecedented economic disruption.
[1] Sample occupations in the non-remote group include: retail salespersons, fast food and counter workers, registered nurses, and construction laborers.
[2] National occupation wages are defined through the Occupation Employment Statistics program.
[3] National occupation growth expectations are defined through the Employment Projections program.
[4] Per the July 15, 2020 Federal Reserve Beige Book: https://www.federalreserve.gov/monetarypolicy/beigebook202007.htm.
[5] Ibid.
[6] The top metros are defined here as those having the most job ad volume in February 2020.
.png)
