Last week we compared how the COVID-19 pandemic impacted online job ads volume across multiple states. In that blog, we found that Ohio had the largest drop in volume of the states investigated, despite not having the infection levels seen in other states. This suggested that the impact on online job ad volume may be tied more closely to a region’s response to the pandemic, rather than the infection rate itself.
In this blog we are exploring Ohio further, to investigate the effect of coronavirus on online job ads at the county level and the variation in impact. Given that the previous blog showed an anecdotal relationship between the aggressiveness of a state’s response and the impacts on online job ad volume, Ohio will be a good test to explore other variables, holding the response variable constant because Ohio’s directives have been mandated statewide, with limited local-level directives.
Using JobsEQ RTI, we tracked online job ads over a six-week period, from the week ending February 23 through the week ending March 29.[1]
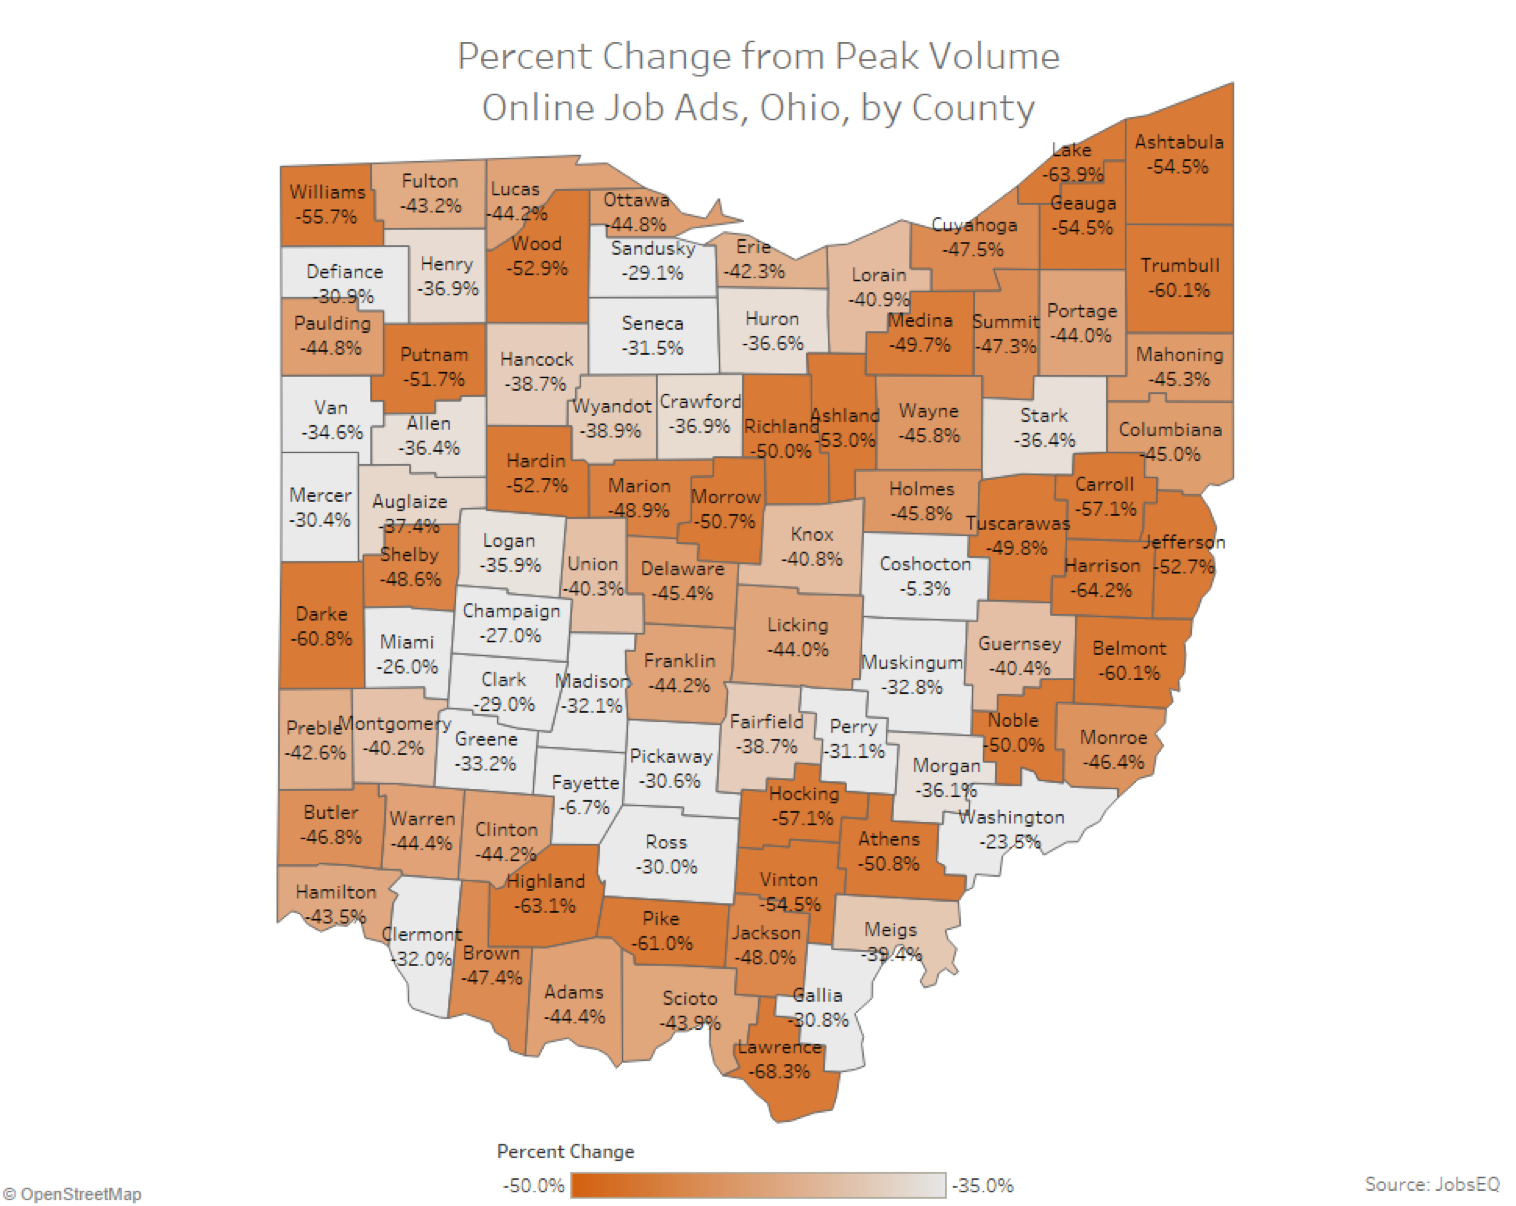
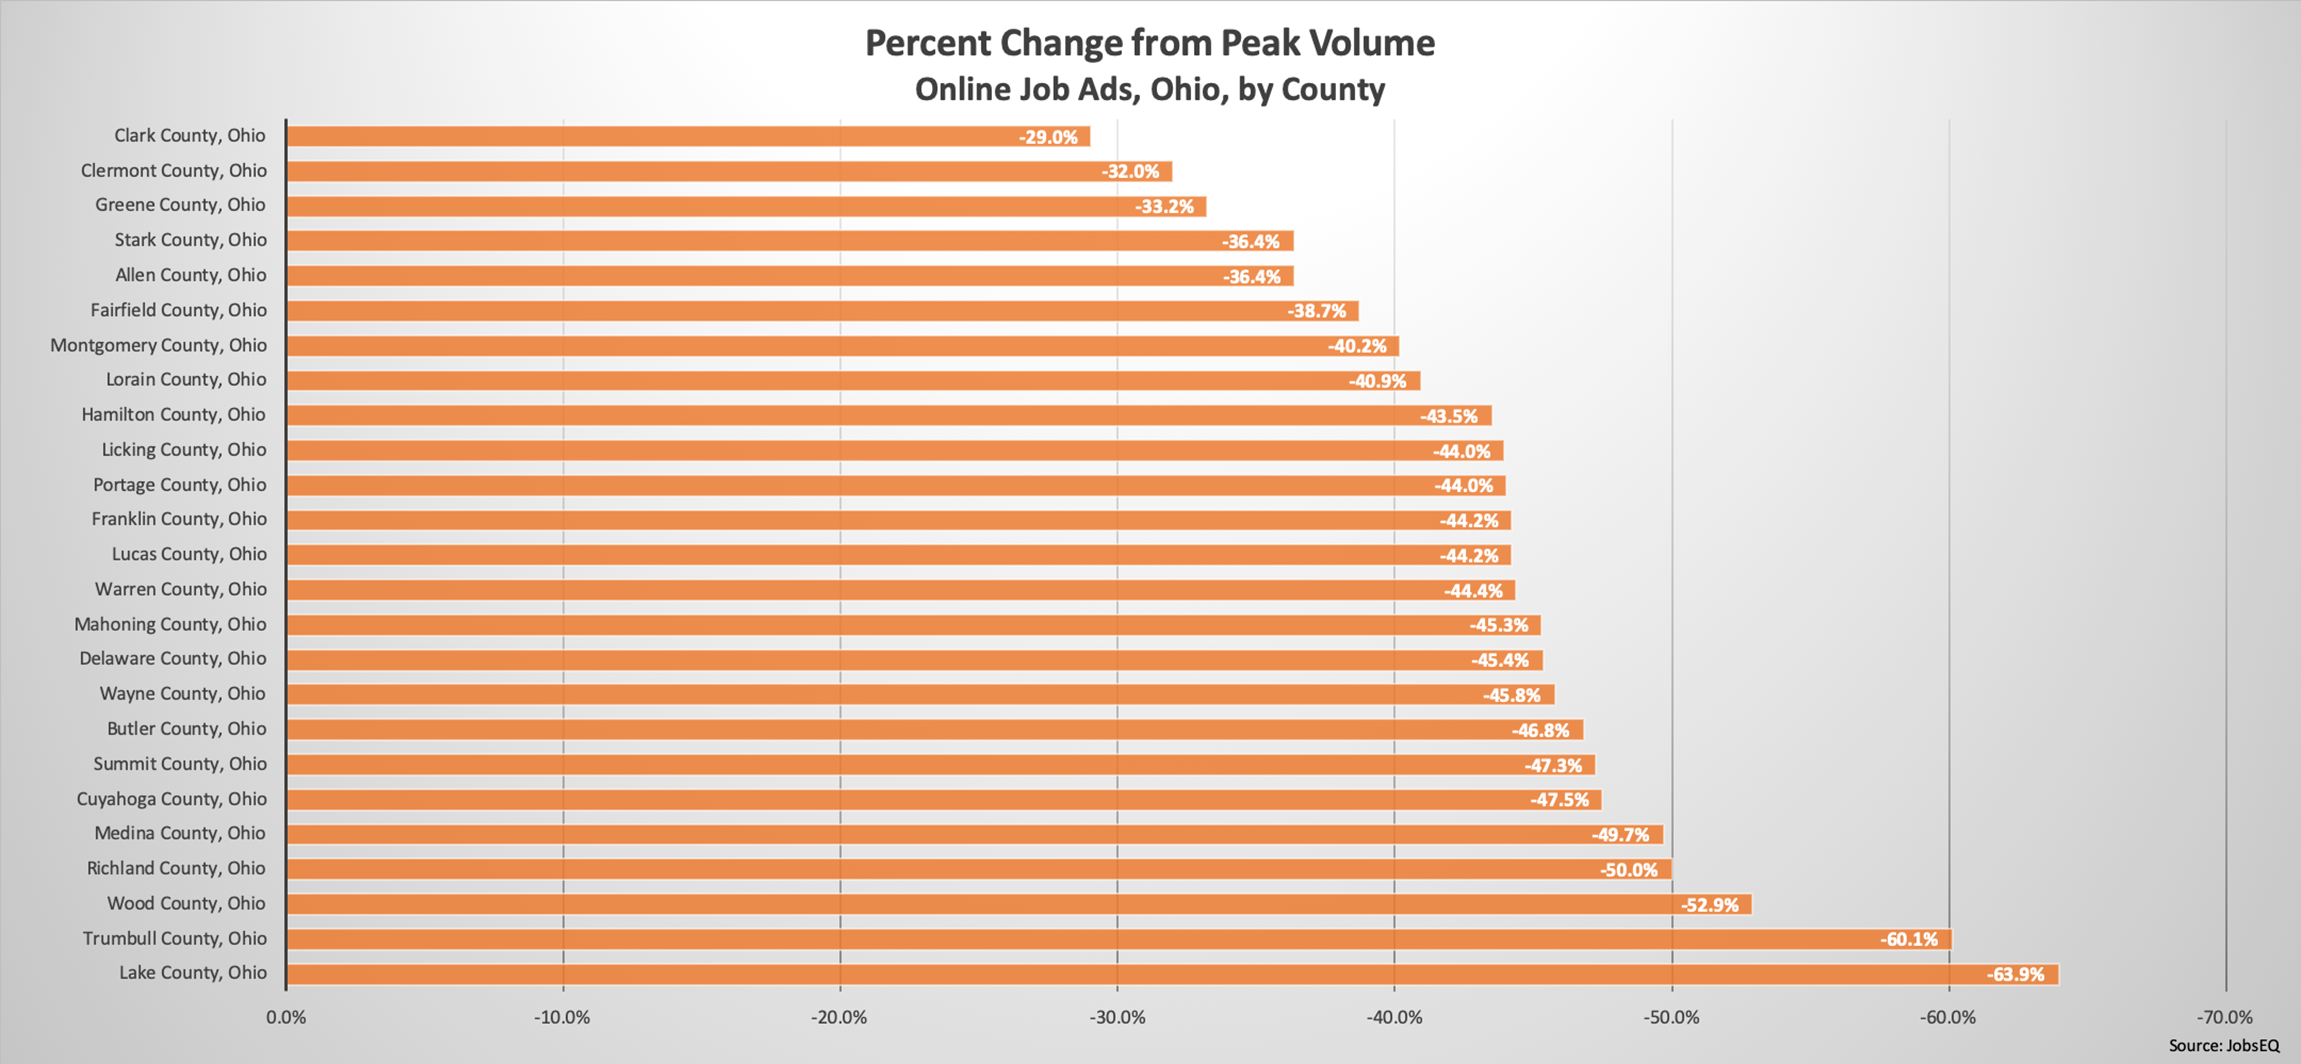
Above is a map of the percent change in online job ad volume from their peak week to the week ending March 29 for each county in Ohio, followed by a chart plotting the percent change for the 25 largest counties by employment. The magnitude of change follows a geographic pattern: of the 25 largest counties, five of the top seven counties with the largest drop in volume (Lake , Trumbull, Medina, Cuyahoga, and Summit counties) are in Northeast Ohio while the three counties with the smallest drop in volume (Clark, Clermont, and Greene counties) are all in Southwest Ohio. This geographic split also follows an infection split, where early on a large majority of Ohio’s confirmed cases were located in Northeast Ohio.[2] Also of note, the county in Southwest Ohio with the largest decline in job ads, Butler County, was the first southwestern county to have a confirmed case. That Northeast Ohio experienced the largest online job ad volume drop is consistent with the rate of infection of the virus also playing a role in the job ad volume changes.
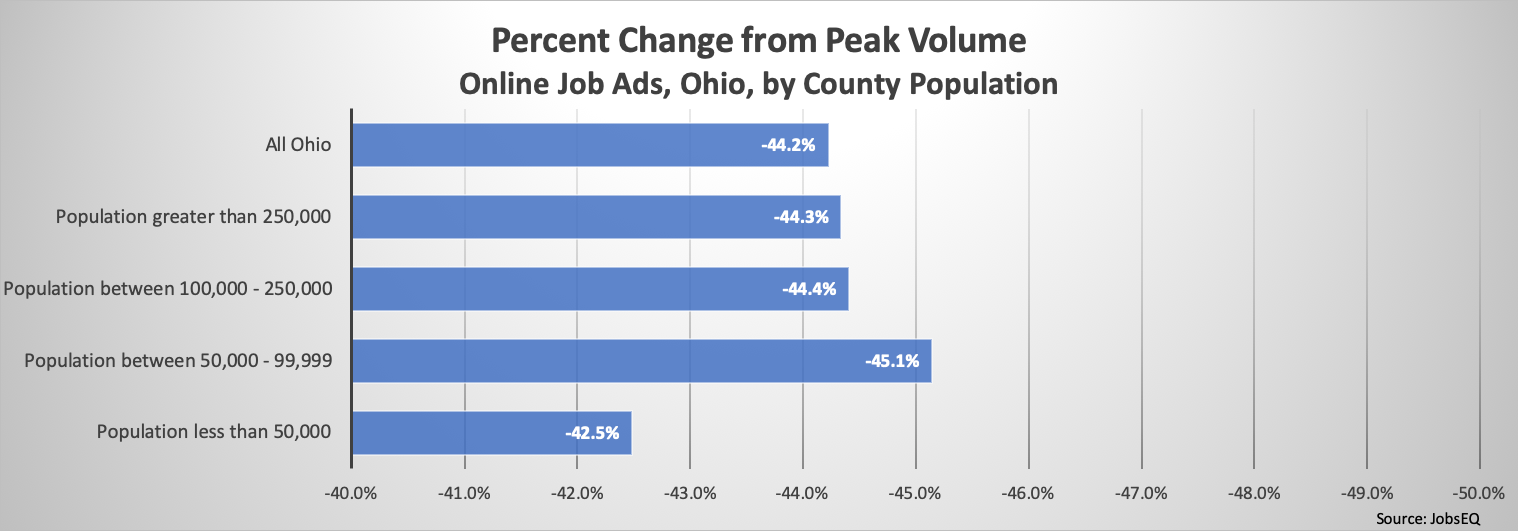
Next we explore the online job ad volume change by population size. In the above chart, counties are grouped into four population buckets and the change in online job ad volume is shown for each bucket. One could argue that the economic impact of the virus is dependent on the population size and the ease of following social distancing mandates – essentially making the economic impact again related to the response to the pandemic, rather than the virus itself. The argument is as follows: regions with lower populations may find it easier for businesses to stay open while limiting large groups or gatherings, thus making it easier to follow social distancing mandates, while businesses in larger and more densely populated regions will struggle to follow the social distancing mandates while remaining open, forcing more closures. The chart above suggests this may be true, at least for the least populous counties. The two largest population groups are virtually identical in ad volume changes, within a tenth of a percentage point of each other, while the third group has the largest drop in volume, but still within one percentage point of the two larger groups. The smallest group, counties with a population less than 50,000, has the smallest drop in volume, 42.5% compared to over 44% in the larger groups. These less populous counties may indeed have a higher portion of their businesses remaining open and posting job ads.
Tying this comparison back to the geographic comparison, Northeast Ohio does have more high population counties (the 13 counties in Northeast Ohio all have populations well above 50,000 and Southwest Ohio has at least six counties with a population of less than 50,000), suggesting there may be something to the population argument. When exploring these changes in more detail, however, we find that the three counties in Southwest Ohio with the smallest changes in job ad volume in all of Ohio (Clark, Clermont, and Greene) have populations ranging from 135,00 to 227,000,[3] well above 50,000. This suggests population size may not be playing as important of a role in the impact on job ad volume.
An alternative explanation for the least populous counties having a smaller drop in job ad volume is that infection rates are likely to be lower in those counties. It is established that population size is a contributing factor to the frequency and severity of disease outbreaks[4] and therefore if the infection rate and severity of the COVID-19 pandemic in a given region is contributing to the magnitude of the negative economic impact in that region, we will expect to see smaller drops in job ad volume in less populous counties. At the same time, there are other factors contributing to the infection rate in a region, and so even among high population counties the infection rate will be variable and impact is more severe in the higher infection rate regions, as we see when comparing the higher population counties in Northeast Ohio to those in Southwest Ohio.
In this Ohio case study, along with last week’s investigation at the state level, results support the conjecture that the economic impact of this virus is being contributed to by both variables, the aggressiveness of the response taken by a region and the infection rate of the virus itself.
[1]Weekly totals are the total number of job ads posted from Monday through Sunday of the specified week. This is the same 5-week period tracked in the previous blog, plus the most recent full week. Data exported from JobsEQ RTI on April 2, 2020
[2]https://coronavirus.ohio.gov/wps/portal/gov/covid-19/home/dashboard
[3]Population data per the American Community Survey (ACS). Population estimates are rounded.
[4]https://www.who.int/water_sanitation_health/emergencies/qa/emergencies_qa9/en/