Over the last few decades, the number of statistics programs in undergraduate higher education has continued to increase [1] —shifting away from the...
Over the last few decades, the number of statistics programs in undergraduate higher education has continued to increase[1]—shifting away from the earlier mindset that statistics courses are merely necessities for graduate studies pursuing other fields. Additionally, since its inception in the late 1990s, enrollment in AP (advanced placement) statistics courses has been increasing[2] more rapidly than for any other subject.
That being said, statistics remains undervalued relative to other subject areas. The National Council of Teachers of Mathematics reports[3] that in 2010, precalculus, calculus, and statistics courses in two-year and four-year colleges enrolled a total of 1.2 million, 900 thousand, and 400 thousand students, respectively. In other words, enrollment is twice as high for calculus courses and three times as high for precalculus courses as it is for statistics courses.
Even among the students taking AP courses, statistics remains overshadowed by calculus. The College Board reports[4] that while there were a little over 200 thousand students taking the AP Statistics exam, there were well over 400 thousand taking an AP Calculus exam.
In this article, we seek to make a case for greater emphasis on statistics in education at all levels, given the current market demand[5] for statistics-related skills. Statistics has come a long way, but it nevertheless still has a long way to go. Why does statistics education matter for the development of a more robust workforce?
Statistics in Education
Perhaps the first item to consider in terms of the viability of investing in more statistics education is how statistics-related programs are doing in academic institutions. The number of statistics-related[6] degrees grew by 52.9% between 2010 and 2016 compared with all other programs which grew by only 12.3% during the same period.
As of 2016, however, 69% of the awards for statistics-related degrees were in General Mathematics—a program that encompasses a broad range of mathematical subjects and, therefore, leads to a variety of occupations beyond that of a statistician. So, how are we to know which areas of expertise employers value most under the large umbrella of “mathematics?”
Skills: Statistics vs Calculus
One way to gauge the value of statistics versus other areas of competency is to consider what skills employers are requesting in job postings. As an example, we used our RTI[7] data to compare the total number of online job postings from 2017 mentioning “statistics” as a skill with those mentioning “calculus” as a skill. While “calculus” was mentioned in roughly 7,500 job postings, “statistics” was mentioned much more frequently, in about 90,000 job postings.
Curiously, while there were 812 job postings for tutors mentioning “calculus,” there were only 423 mentioning “statistics.” In other words, while there are about twelve times as many jobs specifying the need for statistics skills compared to calculus skills, there are twice as many tutors with calculus skills being sought than there are tutors with statistics skills.
Statisticians: A Growing Occupation
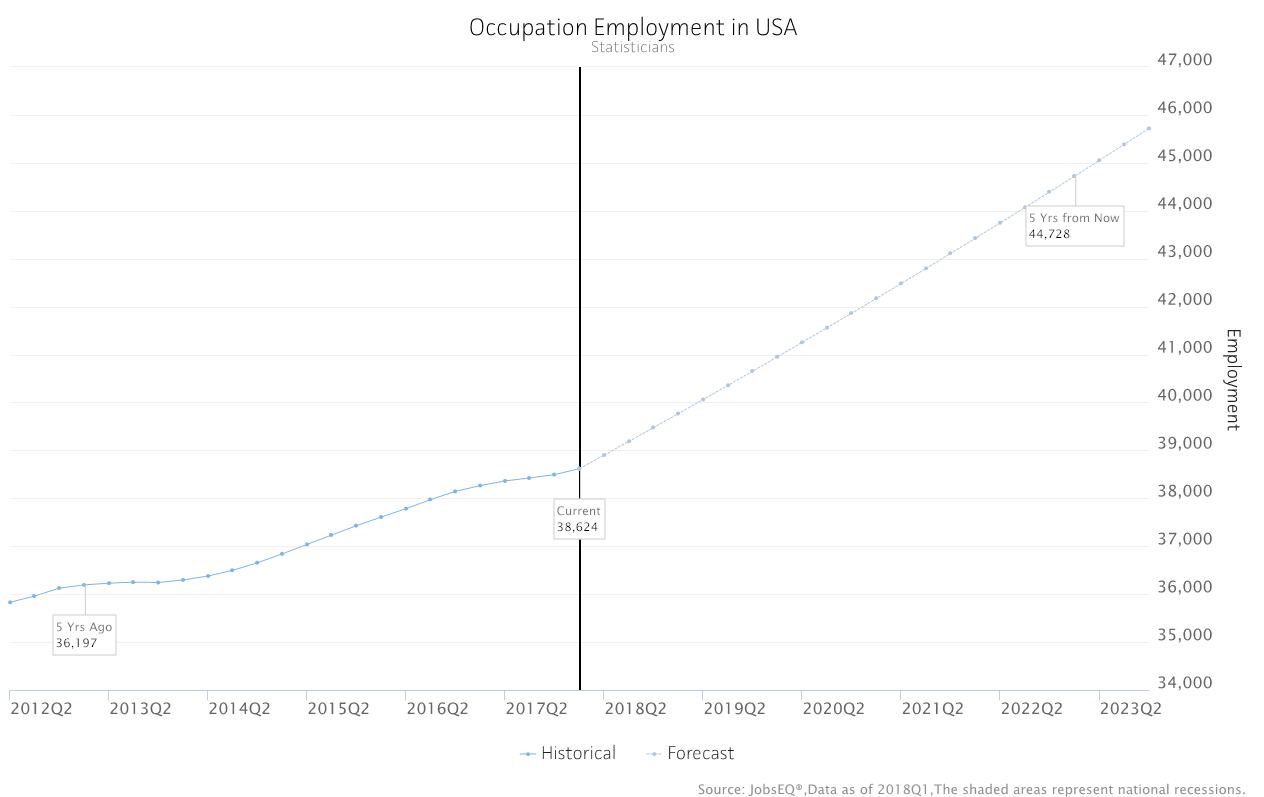
Statisticians as a profession[8] has experienced significant growth in recent years and is projected to continue on a similar trajectory. Employment in the statisticians occupation is projected to grow at an average annual rate of 3.0%, over four times the average of 0.7% for all occupations, making it the seventh-fastest growing occupation of the 800+ standard occupation classifications provided by the BLS.[9]
That being said, relatively few workers are employed directly as statisticians. Despite the rapid growth in the statisticians profession, the current employment level of 38.5 thousand falls far below the average of 189 thousand across all occupations. Does this mean, then, that being trained in statistics is not quite as meaningful as it first appears?
The answer to this question lies in our previous comparison of calculus and statistics. As can be seen, the vast majority of job advertisements requiring training in statistics are not seeking to hire statisticians. Rather than merely considering this single profession, we might consider statistics as a useful skill that can be applied in many different professions.
First, we consider which occupations have a high concentration of workers with statistics skills. In other words, these are the occupations with the highest percentage of job advertisements listing “statistics” as a required skill out of all the job ads for those occupations.
Not surprisingly, statisticians and statistical assistants are at the top.[10] Beyond these explicit statistical fields, though, there is also a good amount of variety among the top occupations—with skills in statistics being sought out in fields including mathematics, information technology, engineering, and finance.
Looking at the concentration of statistics skills within each occupation gives us an idea of how likely the occupations are to require statistics, but it doesn’t tell us the occupations into which most workers with statistics skills are being recruited. For that, we look at the job counts data.
When we consider the count of workers with statistics skills, we are looking at the total job ads listing statistics as a skill for each occupation. In other words, how many job postings for each occupation list statistics as a required skill?
Looking at statistics skills from this angle, we see a somewhat different array of occupations. The top occupation for which workers trained in statistics are being pursued is “computer occupations, all other”—a category including business intelligence analysts and search marketing strategists.
The top 20 occupations hiring workers with statistics skills tend to fall into three general categories—business roles such as management analysts and human resource specialists, managerial roles such as education administrators and medical and health services managers, and information technology roles such as computer and information resource specialists and software developers for applications.
As can be seen, there are five occupations seeking more workers with skills in statistics than the occupation of statisticians, itself.
Adding Complementary Skills
One other piece of information that could be useful in gauging the demand for statistics skills is to think about complementary or dependent skills in job postings. In other words, which other required skills are most likely to show up in job postings along with statistics?
For example, a job posting may not list “statistics,” but it may list “statistical analysis software.” In this case, it is assumed that statistics is also important. Below, we take the most relevant complementary skills[11] into account and look at the breakdown of job postings by occupation just like before.
The skills most highly associated with statistics are shown here. As far as the total volume of job postings, SAS (Statistical Analysis System) is included in job postings also listing statistics as a skill more so than any other skill. However, when it comes to the percentage of all a skill’s job postings that also lists statistics, R (programming language) and Oracle Hyperion are the most complementary skills (that is, most often found together). If we take all of these complementary skills into account, how does it influence the top occupations for statistics?
When adding in complementary skills, the value of statistics in the statisticians and statistical assistants occupations becomes more pronounced. Moreover, one clear trend that emerges is the sudden presence of job postings for occupations in the social sciences—such as epidemiologists and social science research assistants. The inclusion of these occupations makes perfect sense when we consider the requirements for social scientists to learn statistical software packages such as SPSS and SAS—which have been included as complementary skills in this new query.
Adding complementary skills does not dramatically change the overall composition of top occupations in terms of the frequency of job postings requiring statistics skills. However, the volume of job postings increases significantly. The volume of the job ads among the top few occupation doubles and, overall, the total number of job postings increases by about 70%.
Top MSAs for Statistics and Related Skills
One final way of looking at the importance of statistics as a skill is to consider its demand on a geographic basis. Of the job postings from 2017 listing statistics as a skill, where are most of the advertisements coming from? To put it another way, where are people trained in statistics most likely to be working?
As far as the total job ads, the top MSAs[12] listed are not all that surprising, with some of the largest metros—such as New York, Washington DC, Chicago, Los Angeles, and San Francisco—being the locations with the most job ads. However, when the total employment[13] for each MSA is taken into account, only Washington DC, San Francisco, San Jose, and Charlotte remain among the top 15.
Adjusted for employment, the number one MSA for statistics skills is Burlington, North Carolina. In addition to opportunities available from the University of North Carolina, one of the nation’s largest university systems, Burlington is also the national headquarters of medical diagnostic laboratory firm The Laboratory Corporation of America.
Coming in second is Raleigh, North Carolina, which includes Cary, North Carolina—home of one of the largest and most well-known organizations in the world of statistics—the statistical analytics software firm SAS.
Ann Arbor, Michigan—home of the University of Michigan—comes in at the third best MSA for statistics. In addition to Ann Arbor being a relatively small MSA, the University of Michigan is also ranked among the top 10 schools nationwide for both its engineering and business programs—two fields in which statistics is heavily involved.
Each of these remaining cities tells a story about why statistics matters to its local economy. Some are the homes of large academic institutions (i.e. Pennsylvania State University in State College, PA), while others are the headquarters of large financial institutions (i.e. Bank of America in Charlotte, NC). Ultimately, the variety of reasons that statistics remains valuable in these cities further drives home the point—statistics education matters. Whether or not students will grow up to enter into work specifically as statisticians, it is becoming increasingly more likely that they’ll end up in an occupation that relies on statistics in some fashion. Whatever they do and wherever they go, statistics will be there waiting for them. The only question is, will they be ready for it?
[6] ”Statistics-related” programs are defined as the programs that map to the statistician occupation per the NCES CIP 2010 – SOC 2010 Crosswalk. These programs are: General Mathematics (27.0101), General Statistics (27.0501), Applied Mathematics (27.0301), Business Statistics (52.1302), Biostatistics (26.1102), Mathematical Statistics and Probability (27.0502), Computational and Applied Mathematics (27.0304), Other Statistics (27.0599), Mathematics and Statistics (27.0503), and Research Methodology and Quantitative Methods (45.0102).
[7]Chmura’s RTI (Real-Time Intelligence) is a dataset comprising online job postings data in the United States, updated daily, to provide insight on potential hiring. A “job posting” in this dataset is a unique (deduped) job posted from one of more than 20,000 sources which has been analyzed to be classified by SOC and location, along with other information.
[8] Statisticians profession as discussed here corresponds to the BLS SOC (Standard Occupation Classification) 15-2041.
[10] It is certainly reasonable to assume that employers would expect candidates for statisticians and statistical assistants to be skilled in statistics even if it isn’t specifically mentioned in the job ads; nevertheless, these data only reflect when the skill is overtly requested in the ad text.
[11] Complementary skills included are: R programming, Oracle Hyperion, Stata, general statistical software, SPSS, general workforce management software, SAS, general statistical analysis software, general data visualization software, and Minitab.
[12][1] In RTI, Job posting locations are retrieved and assigned to a ZCTA. For this analysis, job postings within each ZCTA were assigned to the corresponding county with the highest employment and then aggregated from the county up to the MSA.