.png)
How would you handle a request from your boss asking whether you’ll be able to continue to attract the right talent needed for your current business operations?
In today’s economy, that conversation might go something like this: The unemployment rate in Northern Virginia is 3.1 percent as of April 2017 and the company’s growth plans are contingent on adding at least 50 more cyber security jobs a year in the Stafford County office over the next four years. I need you to provide me with an assessment of whether we can acquire the talent in the region as well as a contingency plan for expanding to an alternative location where the labor is available.
That is a tall order, but one that Human Resource professionals will continue to receive as the labor market tightens further.
Access to a labor market tool such as Chmura Economics & Analytics’ JobsEQ along with its Real Time Intelligence (RTI) job postings makes the task achievable, especially since “cyber security” is not yet an occupation that the U.S. Bureau of Labor Statistics tracks under their Standard Occupation Classification (SOC) system. This is where job postings data are necessary.
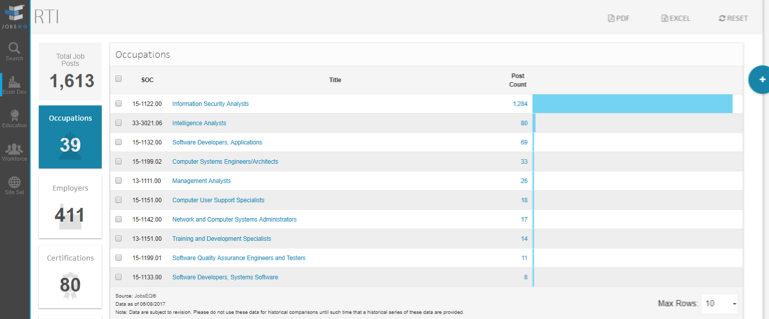
RTI, which is based on scraping and analyzing millions of job postings, allows key word searches. There were 1,613 job openings related to “cyber” in Northern Virginia over the 30 days ending with June 8, 2017. Main competitors in the region are Booz Allen Hamilton with 178 cyber-related job posts, Northrop Grumman with 175, and ManTech International with 64.
The main SOC code associated with these cyber job postings is “information security analysts.” In fact, as shown in the graphic below, that occupation makes up 80 percent of the cyber job postings in Northern Virginia. As of the fourth quarter of 2016, there were 5,529 people employed in the region as information security analysts.

A rule-of-thumb to assess the ability of the local market to meet your workforce needs is to have at least 50 people currently employed in the region with the skills needed for every worker you need to add. From that perspective, Northern Virginia is a good location. There are 111 information security analysts for every one you need (5,529/50), which puts Northern Virginia in a good position to provide the needed workforce.
With all the higher education institutions in Northern Virginia, the pipeline of graduates may also provide additional candidates. The National Center for Education Statistics (NCES) indicates that 1,672 students received a degree for the 2015 academic year in Northern Virginia that would position them well to work as an information security analyst. Your firm tends to hire people with experience or with a master’s degree or higher. From that perspective, the local higher education institutions graduated 286 students at that degree level.
A potential issue with Northern Virginia is the cost of living. Based on the C2ER cost of living index, Northern Virginia is 49.6 percent more expensive than the average for the nation.
Based on these findings it seems prudent to also consider other locations around the nation. You begin by focusing only those locations where there are at least 50 information security analyst jobs in the region per opening to fill. In other words, there needs to be at least 2,500 Information Security Analysts. The accompanying map of metropolitan areas around the country shows that only seven MSAs meet that qualification.

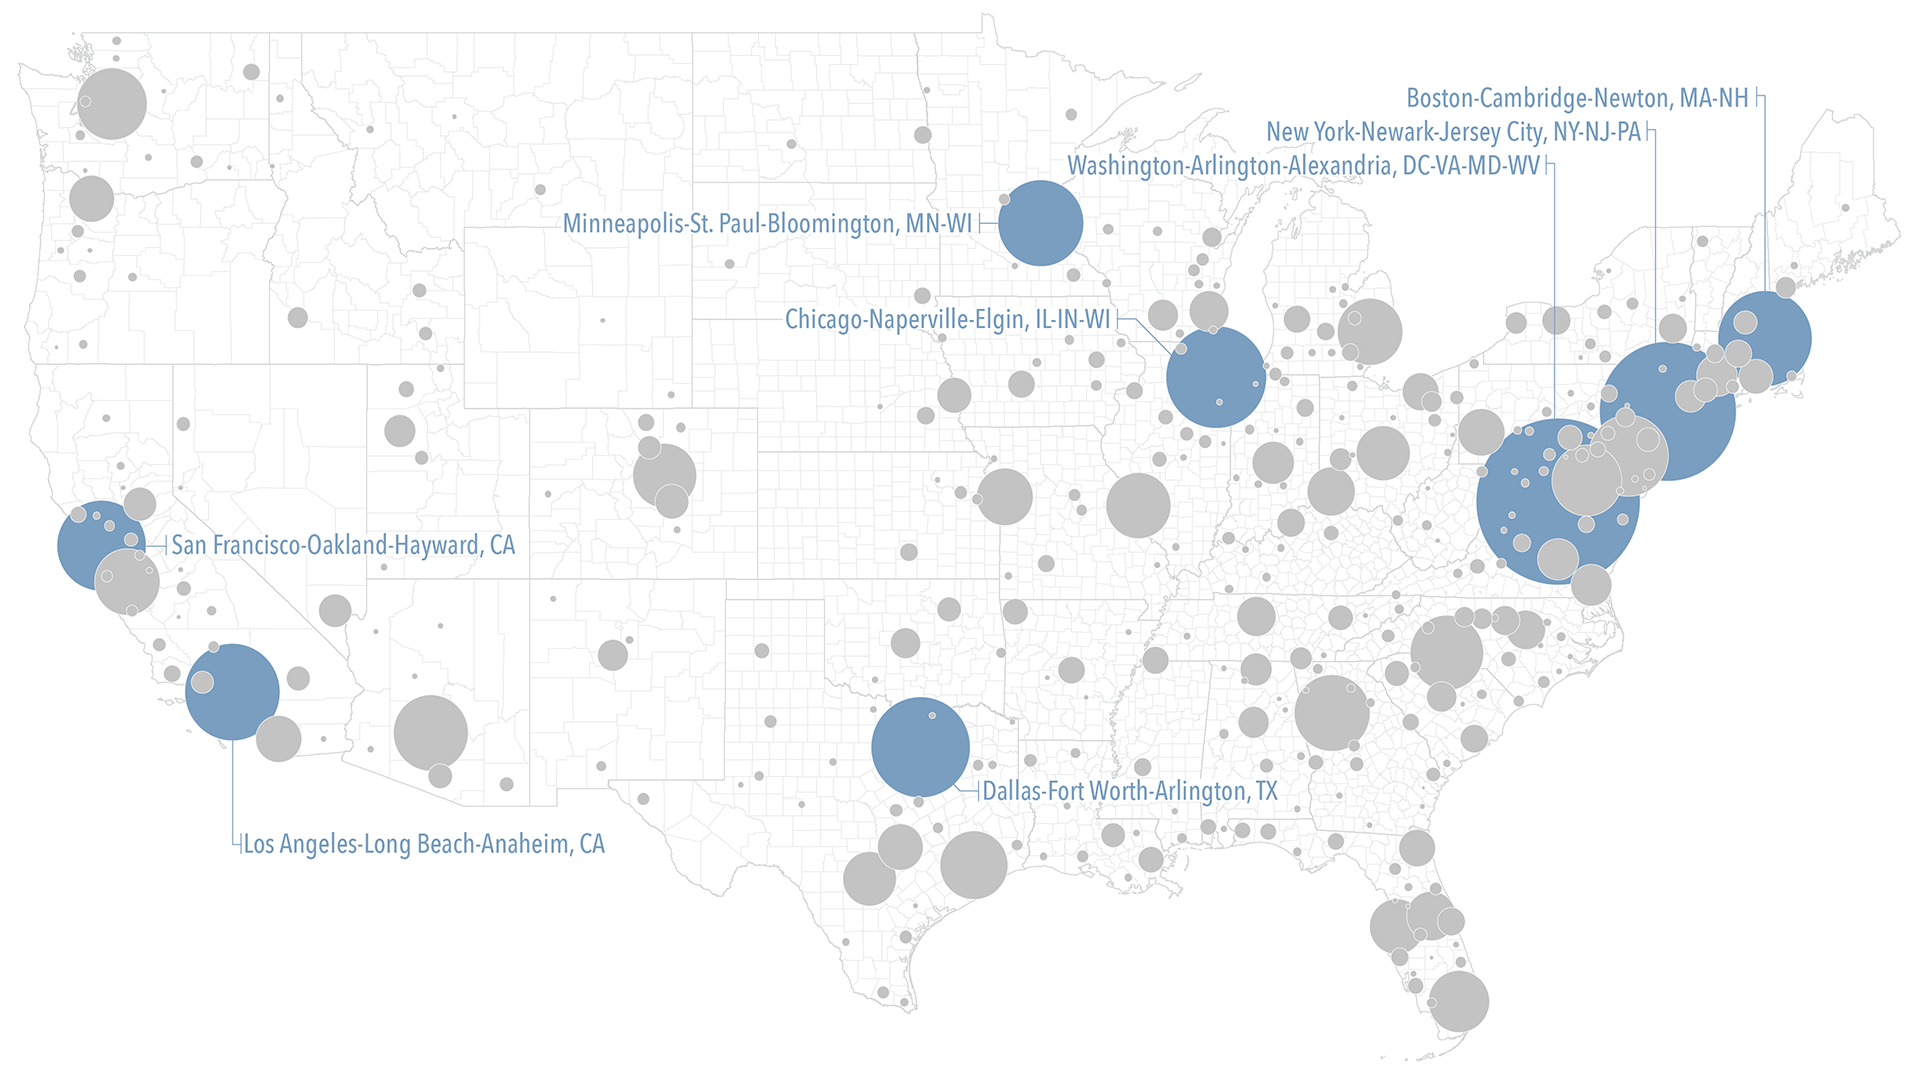
Although the Washington-Arlington-Alexandria, DC-VA-MD-WV MSA is among the metro areas, your firm has historically used only the Northern Virginia portion of the area because of your location in the southern part of the region.
Not surprisingly, all the candidate regions for expansion are large metropolitan areas. The Washington D.C. metro area tops the list followed by New York City and Chicago.
| Region | Number of Employed Information Security Analysts | Potential Candidate to Opening Ratio | Total Awards | Certs and 2-Year Degrees | 4-Year Degrees | Postgrad Degrees | RTI Job Openings Related to Cyber |
|---|---|---|---|---|---|---|---|
| Washington-Arlington-Alexandria, DC-VA-MD-WV MSA | 9,192 | 184 | 4,382 | 1,009 | 1,636 | 1,737 | 2,388 |
| New York-Newark-Jersey City, NY-NJ-PA MSA | 6,408 | 128 | 3,325 | 1,115 | 1,165 | 1,045 | 624 |
| Chicago-Naperville-Elgin, IL-IN-WI MSA | 3,476 | 70 | 3,817 | 1,277 | 1,136 | 1,404 | 241 |
| Dallas-Fort Worth-Arlington, TX MSA | 3,393 | 68 | 1,025 | 679 | 285 | 61 | 282 |
| Los Angeles-Long Beach-Anaheim, CA MSA | 3,143 | 63 | 4,047 | 1,091 | 1,649 | 1,307 | 223 |
| Boston-Cambridge-Newton, MA-NH MSA | 3,088 | 62 | 2,062 | 395 | 1,045 | 622 | 214 |
| San Francisco-Oakland-Hayward, CA MSA | 2,777 | 56 | 926 | 244 | 501 | 181 | 151 |
| Minneapolis-St. Paul-Bloomington, MN-WI MSA | 2,511 | 50 | 1,653 | 538 | 625 | 490 | 110 |
| Northern Virginia Portion of Washington MSA | 5,529 | 111 | 1,672 | 466 | 620 | 286 | 1,437 |
| Source: JobsEQ® Employment represent fourth quarter of 2016; Job openings are for the 30 days ending with June 8, 2017 and awards represent the 2015 academic year. |
|||||||
All the potential regions for expansion provide an ample supply of graduates. Washington, Los Angeles, and Chicago graduated the most potential cyber security candidates in the latest academic year. Individuals with postgraduate degrees are relatively mobile so any region around the country can benefit from those graduates if they are attractive to the students. A natural amenities index created by the U.S. Department of Agriculture rates Los Angeles and San Francisco the highest in terms of amenities.
Of course, payroll costs are a consideration for any firm and particularly professional business firms where payroll makes up the majority of costs. Based on the average wage for each metro area, total annual payroll for 50 information security analysts can vary from $6.0 million in New York to $4.5 million in Minneapolis—a difference of $1.5 million.
| Region | Natural Amenities Index (1 to 7)* | Cost of Living Index (Base US=100) | Average Wage for Information Security Analysts | Total Payroll for 50 People | |
|---|---|---|---|---|---|
| Washington-Arlington-Alexandria, DC-VA-MD-WV MSA | 3.0 | 144 | $108,200 | $5,410,000 | |
| New York-Newark-Jersey City, NY-NJ-PA MSA | 3.6 | 155 | $120,800 | $6,040,000 | |
| Chicago-Naperville-Elgin, IL-IN-WI MSA | 2.7 | 115 | $97,500 | $4,875,000 | |
| Dallas-Fort Worth-Arlington, TX MSA | 4.0 | 101 | $91,600 | $4,580,000 | |
| Los Angeles-Long Beach-Anaheim, CA MSA | 7.0 | 145 | $104,200 | $5,210,000 | |
| Boston-Cambridge-Newton, MA-NH MSA | 3.5 | 145 | $99,600 | $4,980,000 | |
| San Francisco-Oakland-Hayward, CA MSA | 6.7 | 160 | $111,700 | $5,585,000 | |
| Minneapolis-St. Paul-Bloomington, MN-WI MSA | 2.6 | 105 | $89,900 | $4,495,000 | |
| Philadelphia-Camden-Wilmington, PA-NJ-DE-MD MSA | 3.0 | 125 | $97,000 | $4,850,000 | |
| Northern Virginia Portion of Washington MSA | 2.9 | 150 | $107,600 | $5,380,000 | |
| Source: JobsEQ® * U.S. Department of Agriculture. |
|||||
With this information in hand, an expansion decision can be made with more confidence.