California Wildfires and Day-to-Day Job Impacts
Last year, we posted a blog examining the effects of Hurricane Harvey on job postings and, by extension, employment. Below, we take the same...
2017 has seen a very active hurricane season. With several landfalls in the United States, there has been a lot said regarding the costs and economic...
2017 has been a very active hurricane season. Some analysts argue Hurricane Harvey will be one of the most costly natural disasters in history[1].
As a region is preparing for a category 4 hurricane such as Harvey, businesses close down and most people evacuate. When some businesses are destroyed during the hurricane, a rise in unemployment follows.
One indicator of this effect is an increase in initial jobless claims. This is particularly apparent in Texas following Hurricane Harvey, where initial jobless claims jumped from 12,105 the week ending with August 26 to 63,788 the week ending with September 2, immediately following Harvey’s August 25 landfall.
In this article, we examine the potential impact of Hurricane Harvey on employment in the Houston, Texas, region by using daily job postings data. We explore the immediate impact when Harvey first made landfall in Texas along with the impacts, including recovery, in the weeks following.
While not an exact proxy for employment, job postings are a leading indicator—when job postings fall, we can expect new hires and employment to fall as well.
Chmura’s JobsEQ ® RTI[2] dataset is used to measure real-time job postings.
To account for fluctuations in the data beyond the regional impacts of Hurricane Harvey (such as weekly volume patterns), the data shown below are presented as a five-day moving average[3] of new job postings. Furthermore, data are presented as job posting volume relative to the nation, in order to account for seasonal patterns and other national fluctuations; specifically, as the number of new jobs posted in the Houston metro area per 10,000 new jobs posted in the nation.
Source: JobsEQ
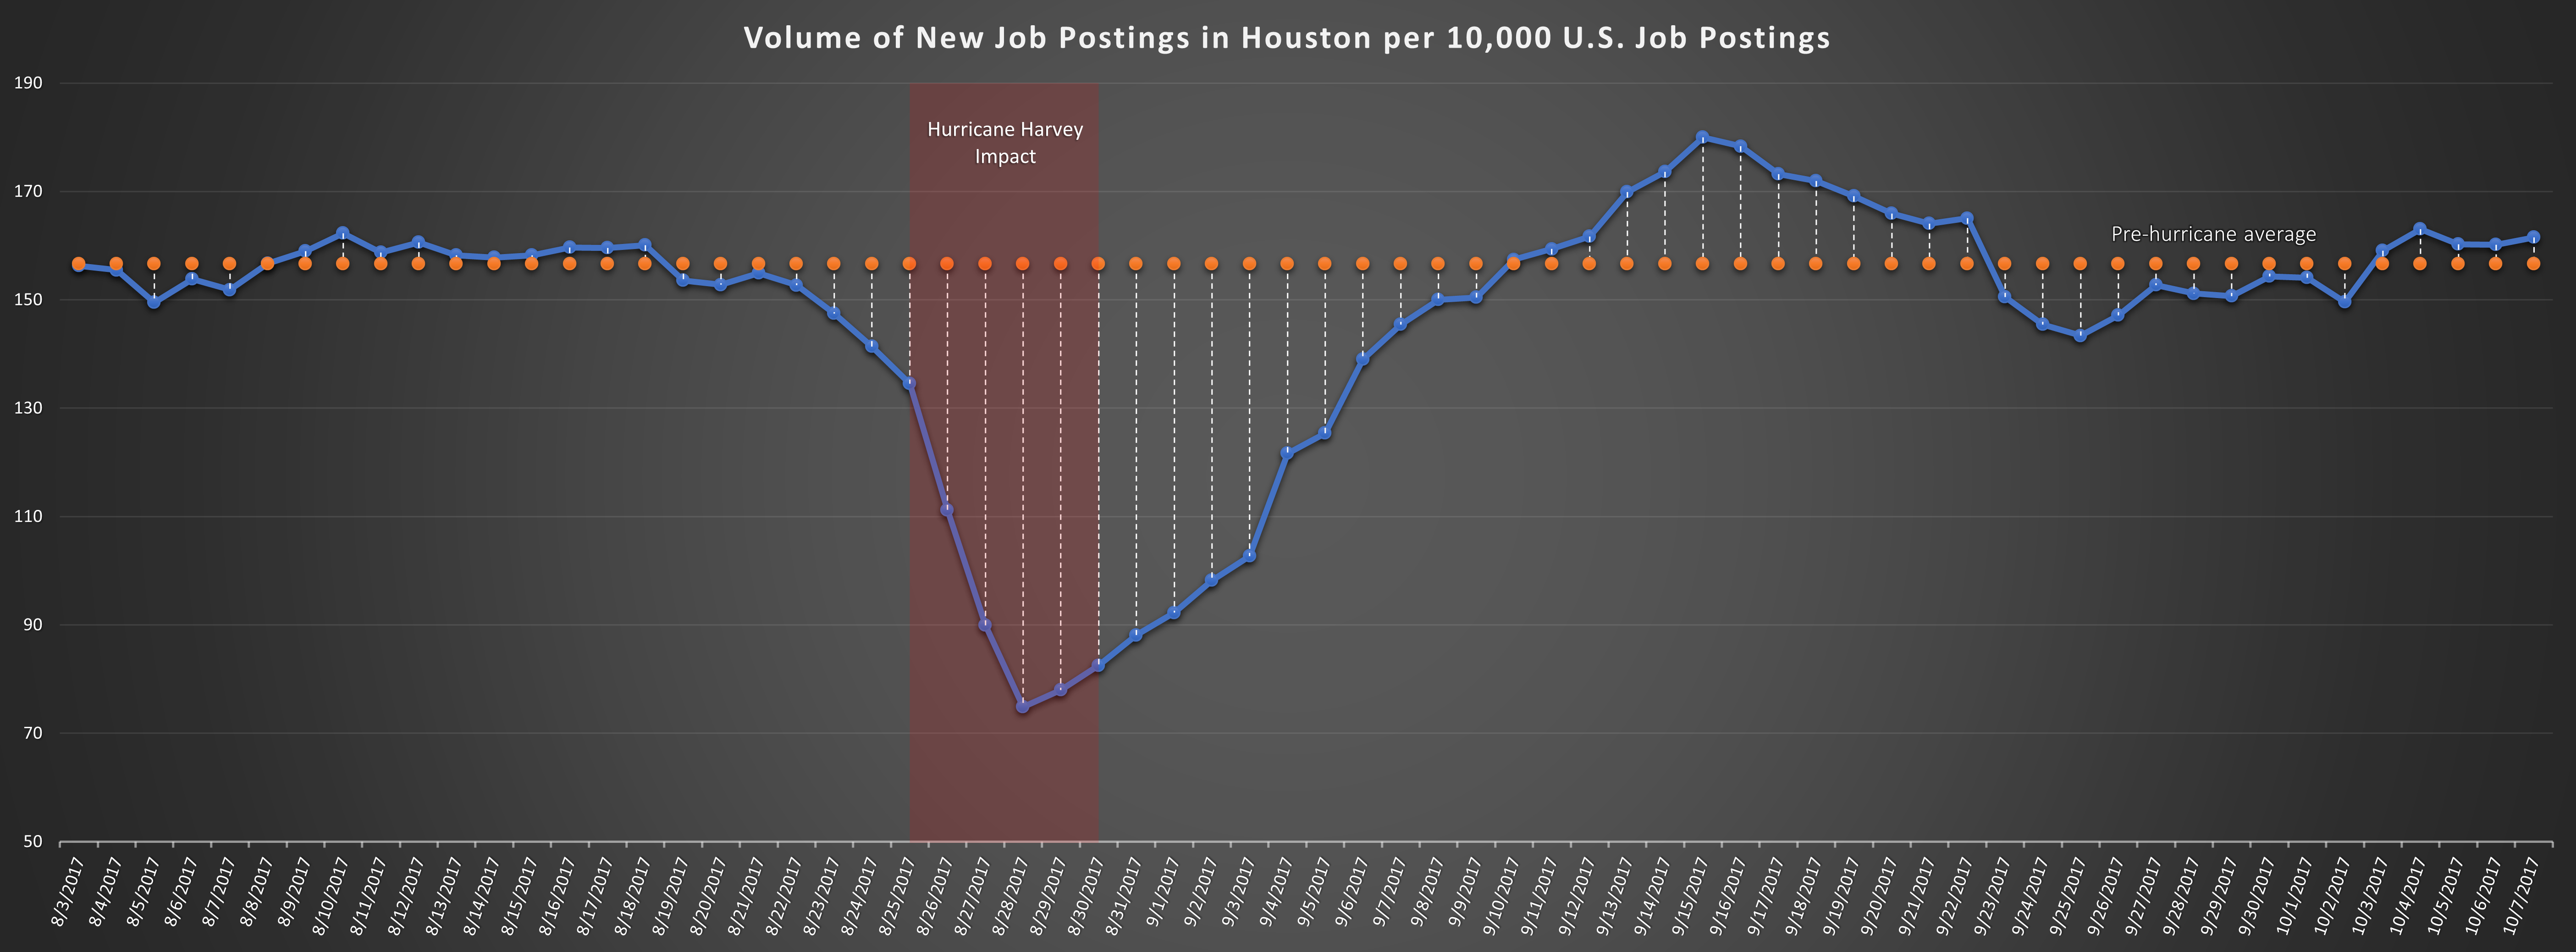
To interpret the graph, a value of 156 on August 3 means that for every 10,000 new jobs posted in the nation on that day, 156 of them were posted in the Houston MSA. A quick scan of this chart shows that leading up to Hurricane Harvey, Houston had a consistent volume of new job openings relative to the USA as a whole, averaging about 157 per 10,000 for the 20 days between August 3 and August 22.
On August 23, volume started to decrease slightly and dropped to 135 on August 25, the day Harvey made landfall in Texas. As the hurricane continued to rain down large amounts of water over the next three days, job posting volume dropped significantly, falling by more than 20% each day. It hit a low of 75 on August 28, only 48% of the daily average prior to the hurricane.
Job advertisements began to increase at this point, including a rapid rise between September 4 and September 6, signaling that recovery efforts had begun. In total, the relative volume of job advertisements in the Houston area stayed below the pre-hurricane average for eighteen days, from August 23 through September 9.
As the recovery efforts further picked up, the relative volume increased slightly above the pre-hurricane average for twelve days, between September 11 and September 22, peaking at 180 (14% above average) on September 15, before settling closer to the pre-hurricane average.
One would expect Hurricane Harvey’s impact to vary across occupations, depending on the degree to which places of employment were disrupted. So, we explore how Hurricane Harvey impacted: education, training, and library occupations; healthcare support occupations; and construction and extraction occupations.
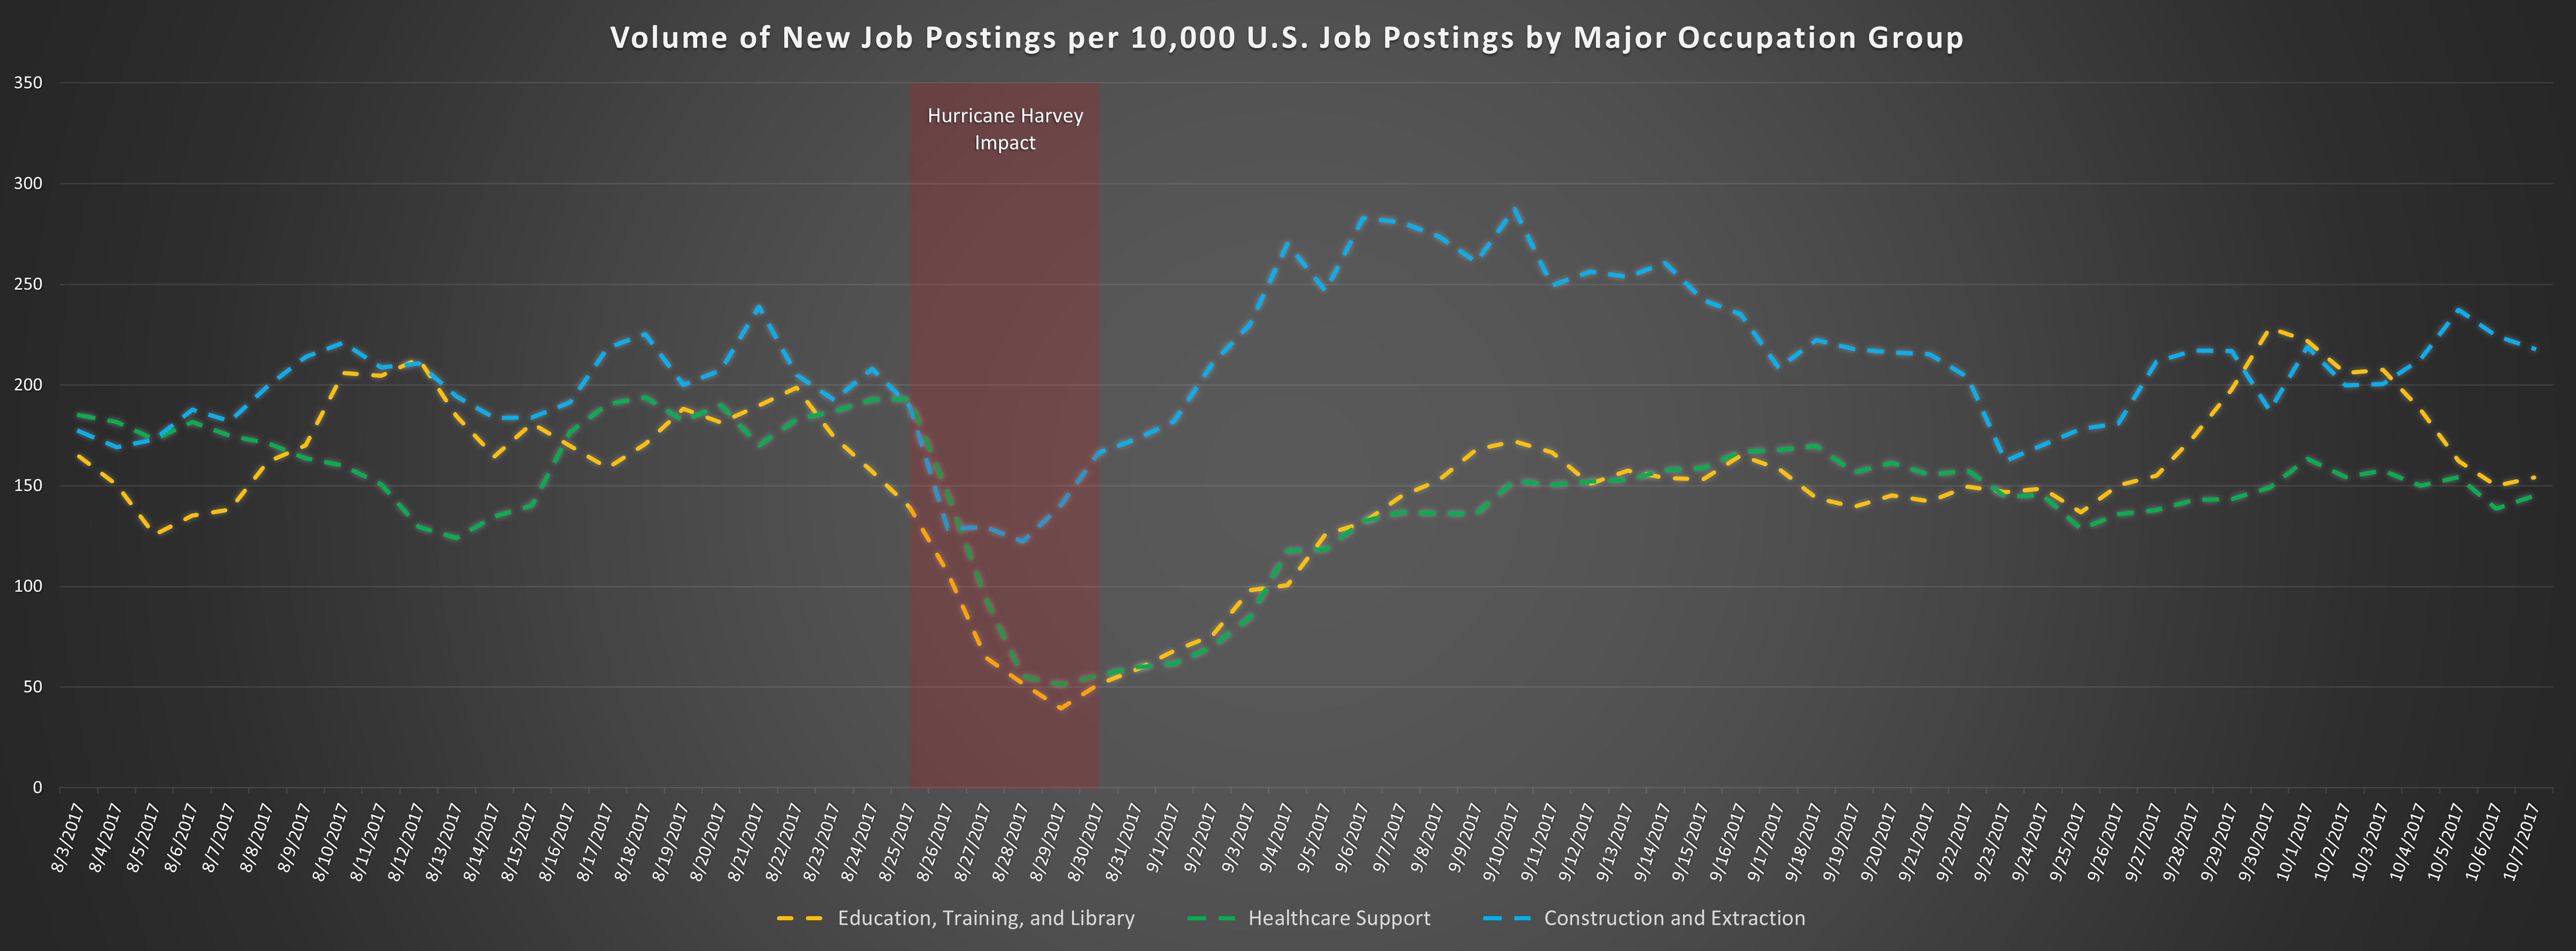
The above chart of the relative volume of the three occupation categories is based on the number of new jobs posted in a particular occupation group per 10,000 new U.S. job postings in that same occupation group, using a five-day average as before.
Not surprisingly, we see that Hurricane Harvey caused a decline in job postings in each of these occupation groups; however, there is a noticeable contrast in the overall impact. Healthcare support as well as education, training, and library occupations had some of the largest declines in relative job postings, decreasing from pre-hurricane averages of 173 and 168 respectively, to lows of 39 and 51 on August 29, only 23% and 30% of the pre-hurricane averages. After hitting these lows, these two occupation groups followed a similar trend to the overall relative job postings, recovering and eventually settling back near their pre-hurricane averages.
In contrast, construction and extraction occupations was one of the least affected occupation groups. Here, relative job postings declined less, falling from a pre-hurricane average of 200 to a low of 122 of August 28, 61% of the pre-hurricane average. Following the low, we see not only rapid recovery in construction job postings but growth above pre-hurricane levels. This is something we might expect, given the rebuilding effort that is required after a major hurricane.
While the peak for total relative volume was achieved on September 15, eighteen days after the low seen during the hurricane, for construction and extraction occupations there is an initial spike to 283 on September 6, just nine days after the low; and it remained well above average for five days before starting to decline and settling back near the pre-hurricane average.
As the data for the Houston region shows, there was a sharp decline in job postings when the hurricane hit, followed by a recovery to return to normal. This decline in job postings doesn’t necessarily mean that employment will fall by the same amount. Some hiring may simply be postponed by a few days or weeks, which could explain some of the increase above the pre-hurricane average seen during the recovery. Regardless, the job postings decline does imply that we can expect to see an overall short-term decline in new hires, and in turn employment, following a major hurricane.
Looking at specific employment categories, it is clear that the employment impact varies by occupation. In this case, we see that a hurricane may lead to overall growth in new hires for construction occupations, where the growth above the average during the recovery far exceeds the decline seen during the hurricane.
[1] Hurricane Harvey and Hurricane Irma have had devastating production impacts on major industries in the regions hit, with oil refineries in Texas and citrus crops in Florida being greatly impacted
[2] Chmura’s RTI (Real-Time Intelligence) is a dataset comprising online job postings data in the United States, updated daily, to provide insight on potential hiring. A “job posting” in this dataset is a unique (deduped) job posted from one of more than 15,000 sources which has been analyzed to be classified by SOC and location, along with other information. http://www.chmuraecon.com/jobseq/real-time-intelligence/
[3] Specifically, the average of the five-day period from two days prior to two days following.
Last year, we posted a blog examining the effects of Hurricane Harvey on job postings and, by extension, employment. Below, we take the same...
Since the beginning of the COVID-19 pandemic, Chmura has been providing updates on the impact the pandemic has been having on online job posting...
Chmura has been using our expected RTI volume model to help measure and track the impact of the COVID-19 pandemic on job postings. In our previous...