Wage Pressure Index Spotlights Hot Job Markets
More and more over the past year, as companies have begun researching expansion initiatives or re-shoring opportunities, Chmura has been asked to...
The federal government spends billions of dollars buying goods and services from private sector firms each year.
The federal government spends billions of dollars buying goods and services from private sector firms each year.
Just as the fortunes of businesses dependent on federal spending ebb and flow with federal budgets, so do the budgets of the metropolitan statistical areas (MSAs) where those employers are concentrated.
| Rank | MSA | Spending in FY2000 (millions) |
|---|---|---|
| 1 | Washington-Arlington-Alexandria, DC-VA-MD-WV MSA | $9,900 |
| 2 | San Francisco-Oakland-Hayward, CA MSA | $1,022 |
| 3 | New York-Newark-Jersey City, NY-NJ-PA MSA | $1,013 |
| 4 | Denver-Aurora-Lakewood, CO MSA | $869 |
| 5 | Knoxville, TN MSA | $796 |
| 6 | Houston-The Woodlands-Sugar Land, TX MSA | $778 |
| 7 | Augusta-Richmond County, GA-SC MSA | $650 |
| 8 | Chicago-Naperville-Elgin, IL-IN-WI MSA | $575 |
| 9 | Kennewick-Richland, WA MSA | $554 |
| 10 | Atlanta-Sandy Springs-Roswell, GA MSA | $552 |
| 11 | Philadelphia-Camden-Wilmington, PA-NJ-DE-MD MSA | $543 |
| 12 | Kansas City, MO-KS MSA | $472 |
| 13 | Los Angeles-Long Beach-Anaheim, CA MSA | $441 |
| 14 | Albuquerque, NM MSA | $421 |
| 15 | Boston-Cambridge-Newton, MA-NH MSA | $420 |
| 16 | Baltimore-Columbia-Towson, MD MSA | $392 |
| 17 | Detroit-Warren-Dearborn, MI MSA | $362 |
| 18 | Dallas-Fort Worth-Arlington, TX MSA | $360 |
| 19 | Las Vegas-Henderson-Paradise, NV MSA | $318 |
| 20 | Joplin, MO MSA | $317 |
| 21 | Pittsburgh, PA MSA | $314 |
| 22 | Albany-Schenectady-Troy, NY MSA | $298 |
| 23 | Cincinnati, OH-KY-IN MSA | $289 |
| 24 | Memphis, TN-MS-AR MSA | $277 |
| 25 | Virginia Beach-Norfolk-Newport News, VA-NC MSA | $270 |
| 26 | New Orleans-Metairie, LA MSA | $244 |
| 27 | San Diego-Carlsbad, CA MSA | $227 |
| 28 | Amarillo, TX MSA | $225 |
| 29 | St. Louis, MO-IL MSA | $216 |
| 30 | Austin-Round Rock, TX MSA | $208 |
| 31 | Huntsville, AL MSA | $202 |
| 32 | Chattanooga, TN-GA MSA | $200 |
| 33 | Cleveland-Elyria, OH MSA | $188 |
| 34 | Minneapolis-St. Paul-Bloomington, MN-WI MSA | $176 |
| 35 | Boulder, CO MSA | $155 |
| 36 | Phoenix-Mesa-Scottsdale, AZ MSA | $153 |
| 37 | San Jose-Sunnyvale-Santa Clara, CA MSA | $149 |
| 38 | Seattle-Tacoma-Bellevue, WA MSA | $147 |
| 39 | Portland-Vancouver-Hillsboro, OR-WA MSA | $134 |
| 40 | Nashville-Davidson--Murfreesboro--Franklin, TN MSA | $134 |
| 41 | Miami-Fort Lauderdale-West Palm Beach, FL MSA | $122 |
| 42 | Sacramento--Roseville--Arden-Arcade, CA MSA | $118 |
| 43 | Lakeland-Winter Haven, FL MSA | $102 |
| 44 | Hagerstown-Martinsburg, MD-WV MSA | $96 |
| 45 | Durham-Chapel Hill, NC MSA | $94 |
| 46 | Lynchburg, VA MSA | $93 |
| 47 | Johnson City, TN MSA | $80 |
| 48 | Tampa-St. Petersburg-Clearwater, FL MSA | $78 |
| 49 | Oklahoma City, OK MSA | $72 |
| 50 | San Antonio-New Braunfels, TX MSA | $72 |
| 51 | Charlotte-Concord-Gastonia, NC-SC MSA | $71 |
| 52 | New Haven-Milford, CT MSA | $69 |
| 53 | Indianapolis-Carmel-Anderson, IN MSA | $66 |
| 54 | Grand Rapids-Wyoming, MI MSA | $62 |
| 55 | Louisville/Jefferson County, KY-IN MSA | $61 |
| 56 | Birmingham-Hoover, AL MSA | $60 |
| 57 | Cedar Rapids, IA MSA | $57 |
| 58 | Lafayette, LA MSA | $57 |
| 59 | Brunswick, GA MSA | $56 |
| 60 | Richmond, VA MSA | $55 |
| 61 | Columbus, OH MSA | $55 |
| 62 | South Bend-Mishawaka, IN-MI MSA | $54 |
| 63 | Jackson, MS MSA | $53 |
| 64 | Pittsfield, MA MSA | $52 |
| 65 | Anchorage, AK MSA | $51 |
| 66 | Boise City, ID MSA | $50 |
| 67 | Beaumont-Port Arthur, TX MSA | $50 |
| 68 | Madison, WI MSA | $50 |
| 69 | Bremerton-Silverdale, WA MSA | $47 |
| 70 | Salt Lake City, UT MSA | $46 |
| 71 | Orlando-Kissimmee-Sanford, FL MSA | $46 |
| 72 | Buffalo-Cheektowaga-Niagara Falls, NY MSA | $46 |
| 73 | Providence-Warwick, RI-MA MSA | $46 |
| 74 | Riverside-San Bernardino-Ontario, CA MSA | $46 |
| 75 | Fresno, CA MSA | $45 |
| 76 | Bridgeport-Stamford-Norwalk, CT MSA | $45 |
| 77 | Omaha-Council Bluffs, NE-IA MSA | $44 |
| 78 | Tucson, AZ MSA | $44 |
| 79 | Iowa City, IA MSA | $44 |
| 80 | Green Bay, WI MSA | $43 |
| 81 | Tuscaloosa, AL MSA | $43 |
| 82 | Idaho Falls, ID MSA | $43 |
| 83 | Dayton, OH MSA | $42 |
| 84 | Fayetteville, NC MSA | $39 |
| 85 | Muskegon, MI MSA | $39 |
| 86 | Modesto, CA MSA | $39 |
| 87 | Morgantown, WV MSA | $38 |
| 88 | Milwaukee-Waukesha-West Allis, WI MSA | $37 |
| 89 | Merced, CA MSA | $34 |
| 90 | Scranton--Wilkes-Barre--Hazleton, PA MSA | $34 |
| 91 | Ann Arbor, MI MSA | $32 |
| 92 | Trenton, NJ MSA | $31 |
| 93 | Urban Honolulu, HI MSA | $31 |
| 94 | Tulsa, OK MSA | $31 |
| 95 | Columbia, SC MSA | $30 |
| 96 | Wichita, KS MSA | $30 |
| 97 | Ogden-Clearfield, UT MSA | $30 |
| 98 | Santa Fe, NM MSA | $30 |
| 99 | Yakima, WA MSA | $29 |
| 100 | Charleston-North Charleston, SC MSA | $29 |
| Source: Chmura Economics & Analytics | ||
Although non-defense contract spending has supported economic growth in many MSAs over the past decade, contract spending by federal agencies besides the Department of Defense will decline when budget reform becomes a priority. When that happens, MSAs whose budgets are more dependent on that spending may experience shortfalls.
In the fiscal year (FY) that ended on September 30, 2015,[1] federal contracts decreased by $5 billion or 1.2%. Sixty-four percent of the purchases made in the most recent fiscal year were driven by the Defense Department.[2] While the majority of federal contract awards support the Defense Department, numerous other federal agencies enter contracts to purchase goods and services.
For example, the Department of Health and Human Services contracts with pharmaceutical companies to produce vaccines and the Department of Energy awards contracts for, among other things, research and development.
Non-Defense Department contract spending advanced at a modest 32% from FY 2005 to 2010 compared with a 49% gain in Defense Department contract spending over the same period. The non-defense spending was particularly strong, jumping by $30 billion from FY 2008 through 2010, as fiscal policy expanded in response to the recession.
After peaking at $152.9 billion in FY 2010, annual non-defense contract spending has declined by only 1%. That compares with a 19.4% drop in Defense Department contract spending after it peaked at $336.7 billion in FY 2009. Annual non-defense contract spending, which peaked at $152.9 billion in FY 2010, hovered around $145 billion from FY 2011 to 2014 before inching up to $151.2 billion in FY 2015.

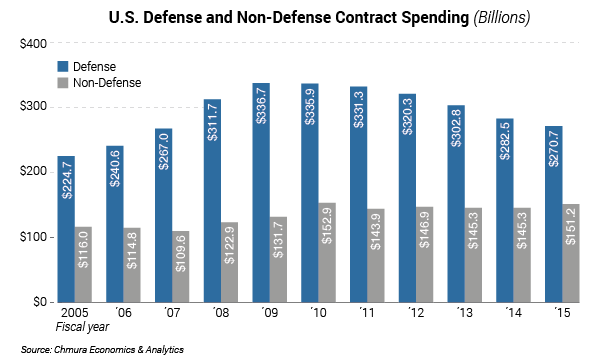
Over the entire ten-year period from FY 2005 to 2015, non-defense contract spending increased $35.2 billion or 30.3%. This represents a 2.7% average annual increase compared with a 1.9% increase in defense contract spending over the same period. The five largest increases in spending from FY 2005 to 2015 occurred in metropolitan statistical areas (MSAs) with populations of at least 2.5 million. On a per capita basis, however, nine of the ten largest increases in non-defense contract spending were in MSAs with populations of less than 1,000,000.
Non-DoD contract spending increased $3,554 per capita from FY 2005 to 2015 in the Idaho Falls MSA. Battelle Energy Alliance operates Idaho National Laboratory, a Government-owned, contractor-operated facility conducting nuclear energy research for the Department of Energy in the Idaho Falls MSA.
On a per-capita basis, non-DoD contract spending increased $3,214 from FY 2005 to 2015 in the Gulfport-Biloxi-Pascagoula MSA. This region is home to the John C. Stennis Space Center, a NASA rocket testing facility. Contractors including Computer Sciences Corporation and HP Enterprise Services perform work at Stennis Space Center.
From FY 2005 to 2015, non-DoD contract spending in the East Stroudsburg, Pennsylvania MSA rose $3,118 on a per capita basis. Global pharmaceutical company Sanofi Pasteur received large contracts from the Department of Health and Human Services to produce vaccines in its Swiftwater, Pennsylvania manufacturing facility.
| MSA | Total Non-Defense Contract Gains FY 2005 to 2015 |
|---|---|
| Washington-Arlington-Alexandria, DC-VA-MD-WV MSA | $16,814,165,419 |
| Baltimore-Columbia-Towson, MD MSA | $2,718,937,331 |
| Boston-Cambridge-Newton, MA-NH MSA | $2,561,989,563 |
| Philadelphia-Camden-Wilmington, PA-NJ-DE-MD MSA | $1,793,736,449 |
| Los Angeles-Long Beach-Anaheim, CA MSA | $1,526,046,564 |
| Durham-Chapel Hill, NC MSA | $1,475,297,394 |
| Gulfport-Biloxi-Pascagoula, MS MSA | $1,251,186,212 |
| Denver-Aurora-Lakewood, CO MSA | $734,444,088 |
| Augusta-Richmond County, GA-SC MSA | $719,503,522 |
| East Stroudsburg, PA MSA | $518,907,310 |
| Idaho Falls, ID MSA | $496,698,414 |
| Huntsville, AL MSA | $485,735,682 |
| Palm Bay-Melbourne-Titusville, FL MSA | $479,553,829 |
| Austin-Round Rock, TX MSA | $478,263,087 |
| Indianapolis-Carmel-Anderson, IN MSA | $467,981,002 |
| New York-Newark-Jersey City, NY-NJ-PA MSA | $459,152,692 |
| Tampa-St. Petersburg-Clearwater, FL MSA | $442,855,923 |
| Harrisburg-Carlisle, PA MSA | $402,595,975 |
| Pittsburgh, PA MSA | $390,683,897 |
| Virginia Beach-Norfolk-Newport News, VA-NC MSA | $383,699,861 |
| MSA | Total Non-Defense Contract Gains FY 2005 to 2015 | $ Gain per Capita |
|---|---|---|
| Idaho Falls, ID MSA | $496,698,414 | $3,554 |
| Gulfport-Biloxi-Pascagoula, MS MSA | $1,251,186,212 | $3,214 |
| East Stroudsburg, PA MSA | $518,907,310 | $3,118 |
| Washington-Arlington-Alexandria, DC-VA-MD-WV MSA | $16,814,165,419 | $2,757 |
| Durham-Chapel Hill, NC MSA | $1,475,297,394 | $2,670 |
| Coeur d'Alene, ID MSA | $356,418,728 | $2,371 |
| Kennewick-Richland, WA MSA | $340,687,406 | $1,221 |
| Augusta-Richmond County, GA-SC MSA | $719,503,522 | $1,219 |
| Houma-Thibodaux, LA MSA | $243,455,945 | $1,147 |
| Huntsville, AL MSA | $485,735,682 | $1,092 |
| Baltimore-Columbia-Towson, MD MSA | $2,718,937,331 | $972 |
| Manhattan, KS MSA | $85,662,766 | $869 |
| Palm Bay-Melbourne-Titusville, FL MSA | $479,553,829 | $844 |
| Missoula, MT MSA | $94,157,102 | $825 |
| Hagerstown-Martinsburg, MD-WV MSA | $203,291,497 | $777 |
| Morgantown, WV MSA | $100,274,121 | $726 |
| Harrisburg-Carlisle, PA MSA | $402,595,975 | $713 |
| Hanford-Corcoran, CA MSA | $101,700,075 | $674 |
| Fargo, ND-MN MSA | $149,126,315 | $638 |
| Lansing-East Lansing, MI MSA | $277,034,010 | $587 |
| MSA | Total Non-Defense Contract Cuts FY 2005 to 2015 |
|---|---|
| Albuquerque, NM MSA | -$1,172,664,844 |
| Las Vegas-Henderson-Paradise, NV MSA | -$864,425,494 |
| Amarillo, TX MSA | -$856,455,560 |
| Knoxville, TN MSA | -$734,016,405 |
| Albany-Schenectady-Troy, NY MSA | -$641,739,567 |
| Kansas City, MO-KS MSA | -$527,221,645 |
| San Francisco-Oakland-Hayward, CA MSA | -$383,575,742 |
| Cincinnati, OH-KY-IN MSA | -$363,333,301 |
| Nashville-Davidson--Murfreesboro--Franklin, TN MSA | -$307,156,592 |
| Charleston-North Charleston, SC MSA | -$290,371,099 |
| MSA | Non-Defense Contract Cuts 2005 to 2015 | $ Cuts Per Capita |
|---|---|---|
| Amarillo, TX MSA | -$856,455,560 | -$3,268 |
| Albuquerque, NM MSA | -$1,172,664,844 | -$1,292 |
| Knoxville, TN MSA | -$734,016,405 | -$852 |
| Iowa City, IA MSA | -$137,893,317 | -$828 |
| Albany, GA MSA | -$113,479,615 | -$739 |
| Albany-Schenectady-Troy, NY MSA | -$641,739,567 | -$728 |
| Canton-Massillon, OH MSA | -$190,377,222 | -$472 |
| Brunswick, GA MSA | -$48,652,325 | -$419 |
| Las Vegas-Henderson-Paradise, NV MSA | -$864,425,494 | -$409 |
| Jackson, MS MSA | -$231,060,733 | -$399 |
[1] The U.S. federal government’s fiscal year begins on October 1 of the previous calendar year and ends on September 30.
[2] Based on Chmura’s FedSpendTOP data that are derived from USASpending.gov data but provide a more accurate picture of federal spending based on the time and place of performance when compared with published federal awards data. The data are adjusted for the length of the contract as well as for an associated subcontract’s place of performance (i.e., regional spending is based on place of performance with out-of-region awards subcontracted into the area added in and in region awards subcontracted out of the region subtracted out); FedSpendTOP data also include purchases by non-DoD agencies which end up in DoD products and have been corrected for errors identified during Chmura’s quality control process.
More and more over the past year, as companies have begun researching expansion initiatives or re-shoring opportunities, Chmura has been asked to...
The topic of sequestration is on everyone’s mind today and the nation’s legislators are faced with some tough decisions. Sequestration, by...
Over the past 10 years, employment gains for applications software developers have outpaced those for nearly all other highly skilled occupations.