Economy
Black Unemployment is Historically Low
The gap between black unemployment rates and the overall unemployment rate has been persistent; but as the nation continues its longest economic...
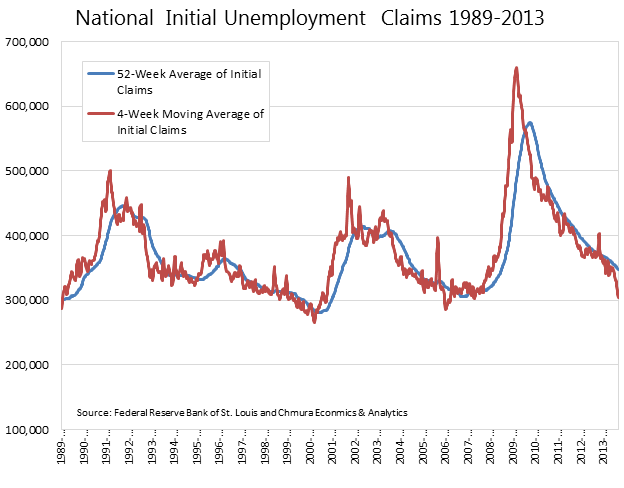
Over the past several months the labor market has been sending out some mixed signals in terms of its relative strength. For instance, initial...
Over the past several months the labor market has been sending out some mixed signals in terms of its relative strength. For instance, initial unemployment claims data—typically a reasonable signal of the overall labor market—has been trending downward and is not far off from a new 35-year low. Once adjusted for the size of the current population, the September figure of the seasonally adjusted 4-week moving average of 305,000 initial claims would “traditionally” be associated with a very strong labor market. In October the number of claims have edged upwards, but still remain fairly low.
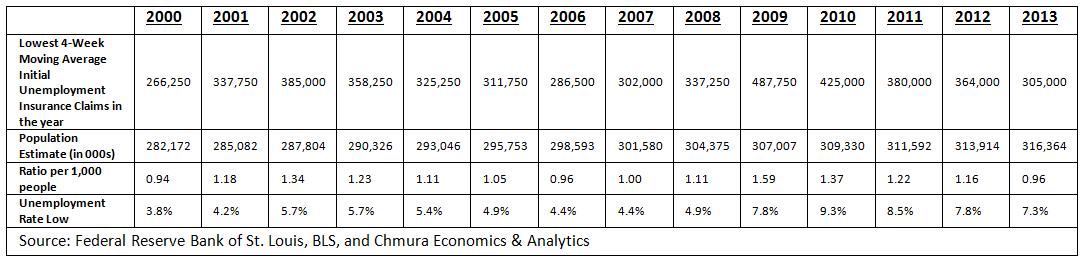
Recently several economists & bloggers—Marginal Revolution, The Money Allusion, Calculated Risk, and others—have noted the disconnect between the recent unemployment claim numbers and the rest of the labor market—job creation, the unemployment rate, and wage growth. Some have taken it as a sign that the labor market is not really as weak as the headline unemployment rate suggests, while others see it as a symptom of the decline of manufacturing, which frequently relies on mass layoffs to adjust output. At its lowest in early 2000 there were 0.94 claims per 1,000 people in the country. The only other periods to approach this—1989 and in 2006—the same metric was 1.16 and .96 respectively. As of the end of September, the current rate was .96 claims per 1,000 citizens—given a U.S. population estimate of 316.4 million in 2013.


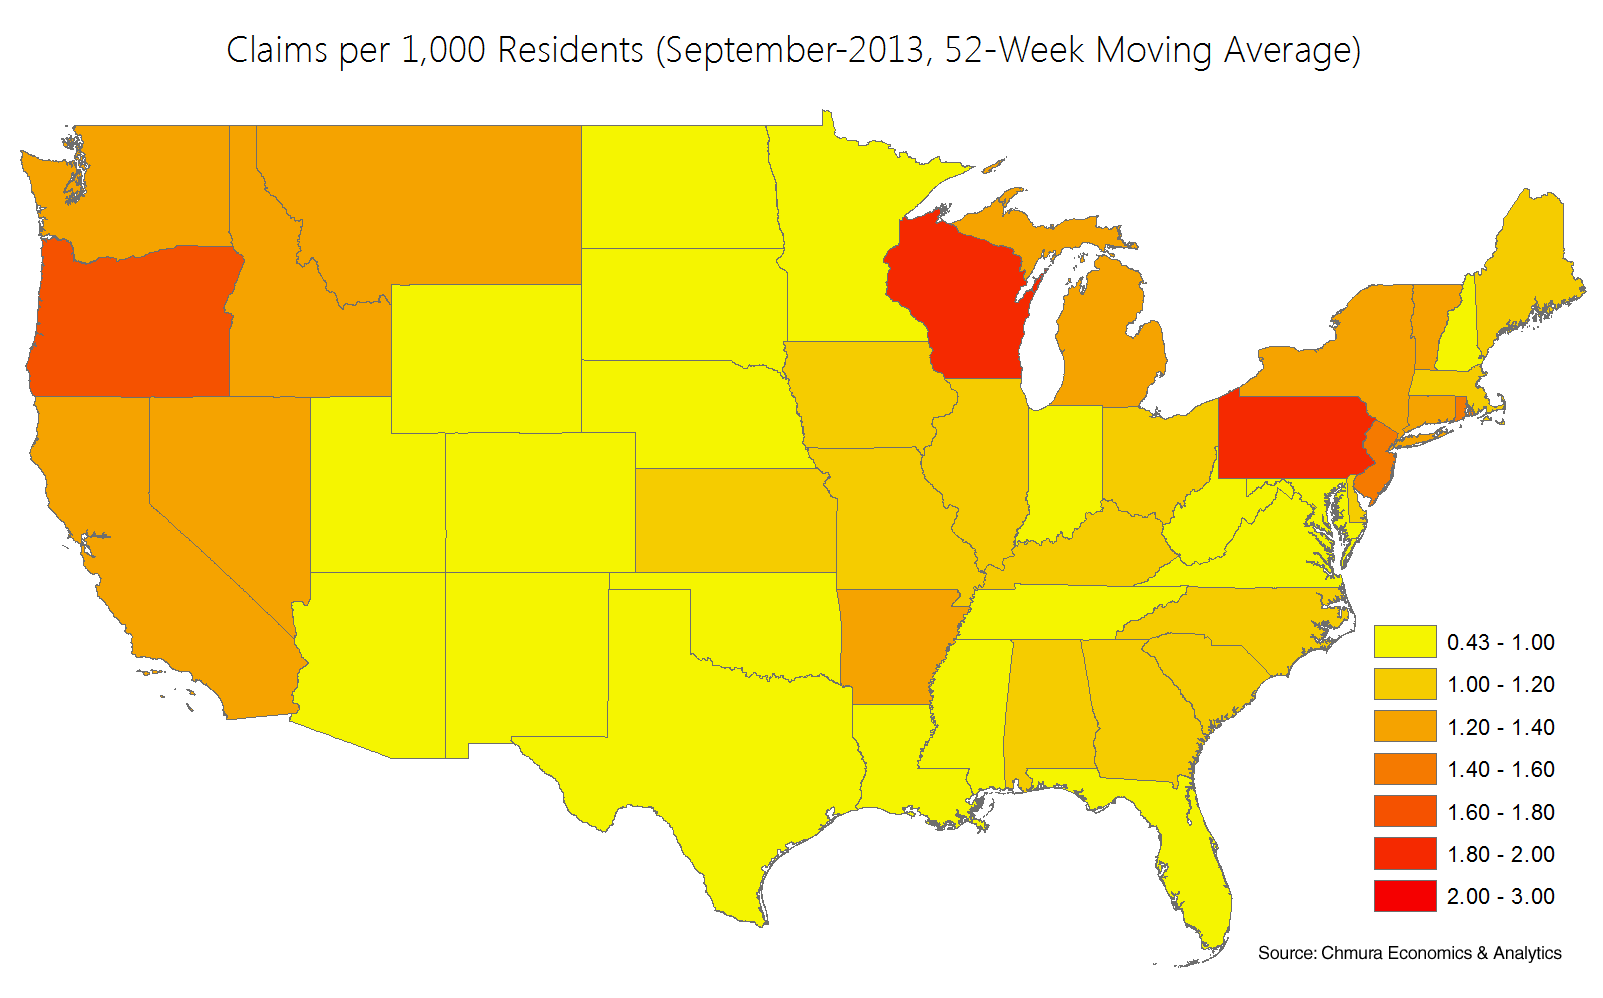
However, masked in these national numbers is the marked difference in claims data between the states. Similar to our analysis that showed great disparity in job gains by state, the claims data shows a very different picture when examined at the state level. While some states are at or near record lows in terms of the level of unemployment claims per 1,000 residents, other states are still well above the number of monthly unemployment claims that would signal a return to a healthy labor market.

In contrast to the past two recoveries where a vast majority of states had also seen their claim data nadir in close correlation with the national job market, this recovery has seen several states lag well behind the leaders in terms of layoff declines. One simple measure is to see how the average state was doing in terms of its claims per 1,000 residents when the national economy experienced a new low in initial claims. The elevated figure for this simple average among the 50 states and the District of Columbia in 2013 also features a higher weighted variance for these claims per 1,000 people currently among the states as compared to the corresponding periods in 2000 and 2006.
| 2000 | 2006 | 2013 | |
|---|---|---|---|
| National Low in 52-Week Moving Average of Initial Claims per 1,000 People | 0.94 | 0.96 | 0.96 |
| Average of All States 52-Week Moving Average of Initial Claims per 1,000 People (same week as national low) | 1.01 | 1.04 | 1.11 |
| Source: Federal Reserve Bank of St. Louis and Chmura Economics & Analytics | |||
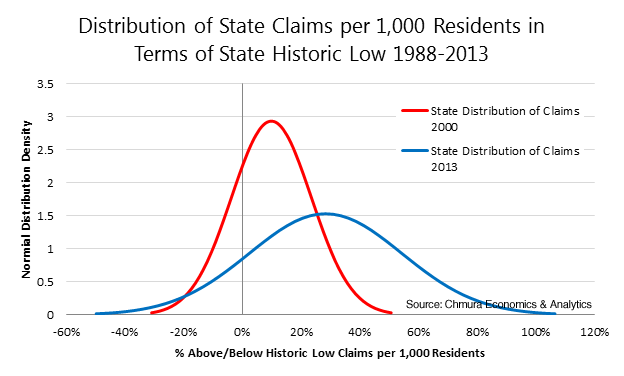
Another way to examine this is look at the 52-week moving average of claims by state to see in each of these periods—1989, 2000, 2006, and 2013—how close each state was to its lowest ever ratio of claims per 1,000 residents. For instance in 2000 and 2006, on average when the nation claims rate bottomed out in terms of initial claims the average state was within 14 and 17 percentage points respectively above its historic low of number of claims per 1,000 residents. In contrast in 2013, as the nation approaches its historic low for initial claims per 1,000 residents, on average the states are 26 percentage points above their previous historic low.
Essentially many states approached their historic lows in 2000 and in 2006, but much fewer states are close to their historic lows currently despite the healthy national numbers in terms of initial claims. Another way to think about it would be to posit that the economic expansions in the late 1990s and mid 2000s were rising tides that spread business activity relatively broadly across most states and MSAs. Whereas today’s expansion is a more of story of states that have and have not, where several states are beginning to forge new records for employment and many other states lag significantly behind in terms of their labor market.

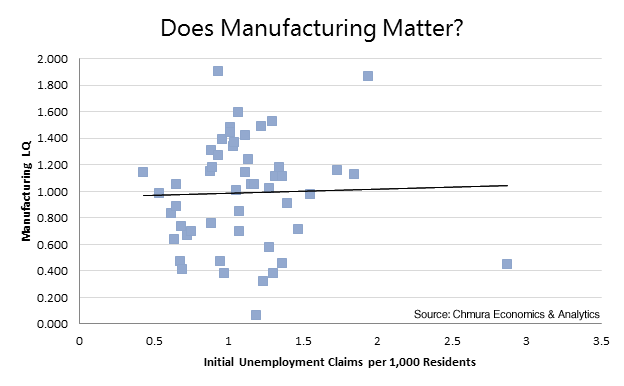
While it is possible that the average of initial claims per 1,000 will narrow across many more states as the nation actually reaches new 35-year low of claims per 1,000 citizens, it is unlikely that the states which have the highest current claims rate will make enough progress in the next several months to fundamentally change the shape of this distribution. This would require large drop of in claims in Alaska, Wisconsin, Pennsylvania, Oregon, and New Jersey all of which have more been averaging more than 1.5 claims per 1,000 residents for the past year. Furthermore, we find little preliminary evidence lately that the level of initial unemployment claims are associated with the size of the manufacturing sector—as gauged by the location quotient, but we will explore this relationship more fully in subsequent blogs.

The gap between black unemployment rates and the overall unemployment rate has been persistent; but as the nation continues its longest economic...
In a period of historically low unemployment , it seems the nation could be running out of people to fill jobs. Indeed, employers regularly report...
The unemployment rate is dropping and jobs are becoming more plentiful, but that doesn’t mean workers are in their ideal jobs. Some people who are...