Written by Patrick Clapp and Chris Chmura.
The impact of shutting down the U.S. government is much larger than the 800,000 federal workers who are staying at home and not spending money on commuting and lunch. Even though Congress has agreed to pay these workers, the reduction and shutdown of certain services is rippling through the economy.
The Wall Street Journal cites an estimate from J.P Morgan Chase economists that “each week of a shutdown would reduce the annualized pace of fourth-quarter economic growth by 0.12 percentage point.” However, the forecast only looks at effects on government workers, not the private sector or consumer confidence.
One question missing from the various lists of FAQs about the shutdown is whether any private sector industries could be affected. Fewer people are making retail purchases, going out to eat, enjoying arts or entertainment, and/or traveling and staying at hotels when tourist attractions like the Grand Canyon or Smithsonian museums are closed. They might also delay big purchases, like a new house, even if they could get a loan from an understaffed Federal Housing Administration. That gives us four North American Industrial Classification System (NAICS) sectors for closer inspection: retail trade (NAICS code 44), real estate and rental and leasing (53), arts, entertainment and recreation (71), and accommodation and food services (72).
Next, we need to look at a comparable period. The last time the government shut down was between December 16, 1995 and January 6, 1996, a total of 21 days. We consider the effects on our selected sectors around that period for metropolitan statistical areas (MSAs). We also consider the percentage of federal employees in the area during that time period—areas with a higher percentage of federal workers implies those areas would have more furloughed workers, and likely larger impacts on local industries. Data are obtained from Chmura’s database powering the EQSuite®.
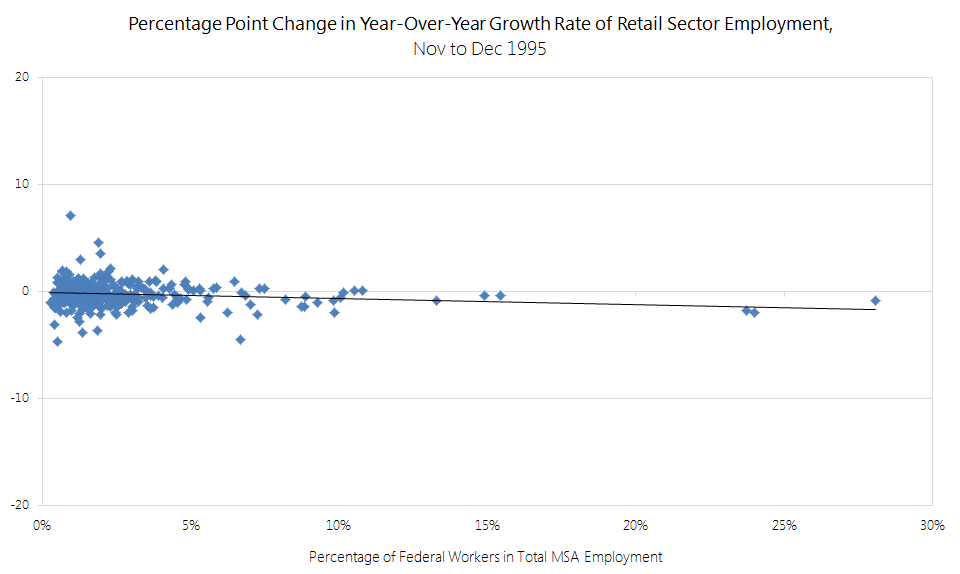
For each of the four sector categories in every MSA, we first calculated the year-over-year percent change in employment by month and wages by quarter to filter out some seasonal fluctuations. The graphs later in this post shows the percentage point changes in growth rates month to month or quarter to quarter relative to the number of people employed by the federal government in each region as a percent of total regional employment. With less demand during the shutdown, we would expect firms in these industries to cut back employees’ hours, which would show as a decrease in the growth rate of wages. To a lesser extent, they might cut their staff size, which would appear as a negative growth rate in employment.
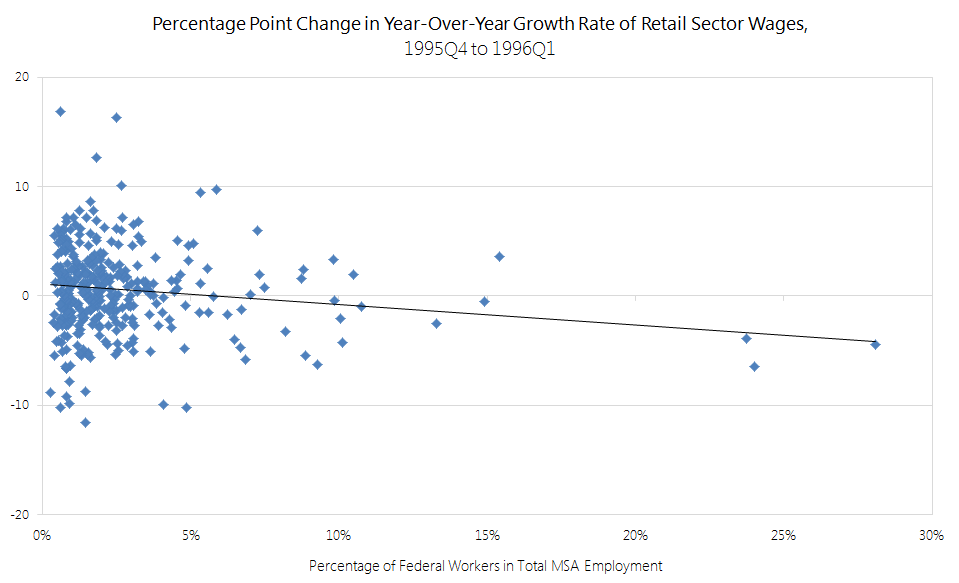
Now for some results: The clearest story is in the retail sector, where there was a strong negative relationship between the percentage of federal employees in a region and changes in the growth rate of wages quarter to quarter in the time periods surrounding the last government shutdown. Employment in the retail sector also declined, but not as dramatically as wages, implying that businesses cut hours, rather than laying off workers to cope with the government shutdown.
The Washington, D.C. metro area ranked fifth of 353 MSAs in the percentage of federal employees in the workforce. The year-over-year growth rate in wages in the retail sector slowed 0.6 percentage points between the last quarter of 1995 and the first quarter of 1996. In the metro area with the largest percentage of federal workers, Warner Robins, Georgia, the year-over-year growth rate of retail wages fell 4.5 percentage points over that time.

Tourist areas such as national parks and museums also suffered. The year-over-year growth rate of retail wages in the Flagstaff, Arizona MSA, near the Grand Canyon, fell 1.7 percentage points between the last quarter of 1995 and the first quarter of 1996.
The effects of furloughed workers rippled through the arts, entertainment, and recreation sector as well. As federal employees were unsure if they would get paid, metro areas with a large percentage of federal employees experienced sharper drops in wages for this sector over the shutdown period and a similar drop in employment. In the Jacksonville, North Carolina MSA, home of Marine Corps Base Camp Lejeune, the year-over-year employment growth rate in the arts, entertainment, and recreation sector fell over 16 percentage points between December and January.
The year-over-year growth rate of employment and wages in the real estate sector and accommodation and food services sector were not negatively affected, suggesting they are more resistant to uncertainty caused by a government shutdown. This makes intuitive sense for the real estate sector in particular—if the only thing keeping someone from purchasing a house is delayed paperwork at the FHA, they are still going to buy a house, just somewhat later than expected.
Percentage Point Change in Year-Over-Year Growth Rate of Wages in Select Sectors,
Fourth Quarter of 1995 to First Quarter of 1996 |
| |
% Federal
Employees |
Retail Trade |
Real Estate |
Arts
Ent
& Rec |
Accom
& Food Svcs |
| Warner Robins, GA MSA |
28.1% |
-4.5 |
4.9 |
-14.0 |
-0.4 |
| Bremerton-Silverdale, WA MSA |
24.0% |
-6.5 |
10.0 |
-6.1 |
3.1 |
| Washington-Arlington-Alexandria, DC-VA-MD-WV MSA |
14.9% |
-0.6 |
* |
-3.2 |
-1.2 |
| Jacksonville, NC MSA |
13.3% |
-2.5 |
-10.8 |
-6.3 |
-3.9 |
| Lawton, OK MSA |
10.8% |
-1.0 |
-1.6 |
8.9 |
1.1 |
| Fairbanks, AK MSA |
10.5% |
2.0 |
27.1 |
2.0 |
-5.7 |
| Fort Walton Beach-Crestview-Destin, FL MSA |
10.1% |
-4.2 |
3.5 |
16.6 |
12.8 |
| Huntsville, AL MSA |
9.9% |
-0.5 |
-1.4 |
-10.5 |
-4.4 |
| Anniston-Oxford, AL MSA |
9.8% |
3.3 |
3.6 |
1.1 |
-6.1 |
| Clarksville, TN-KY MSA |
8.7% |
1.6 |
-2.9 |
2.0 |
7.8 |
| Anchorage, AK MSA |
8.2% |
-3.2 |
-3.4 |
6.7 |
-2.1 |
| Cheyenne, WY MSA |
7.5% |
0.8 |
-14.6 |
-17.9 |
-0.7 |
| Honolulu, HI MSA |
7.3% |
1.9 |
4.3 |
-1.9 |
1.4 |
| Las Cruces, NM MSA |
7.2% |
6.0 |
-44.7 |
-8.3 |
8.2 |
| Lebanon, PA MSA |
6.8% |
-5.8 |
-4.9 |
-0.3 |
-0.5 |
| Bakersfield, CA MSA |
6.7% |
-1.3 |
-8.0 |
0.2 |
2.6 |
| Texarkana, TX-Texarkana, AR MSA |
6.7% |
-4.7 |
2.9 |
-1.0 |
-4.3 |
| * Data for the real estate sector of the Washington, DC metro area is unavailable prior to 2001 |
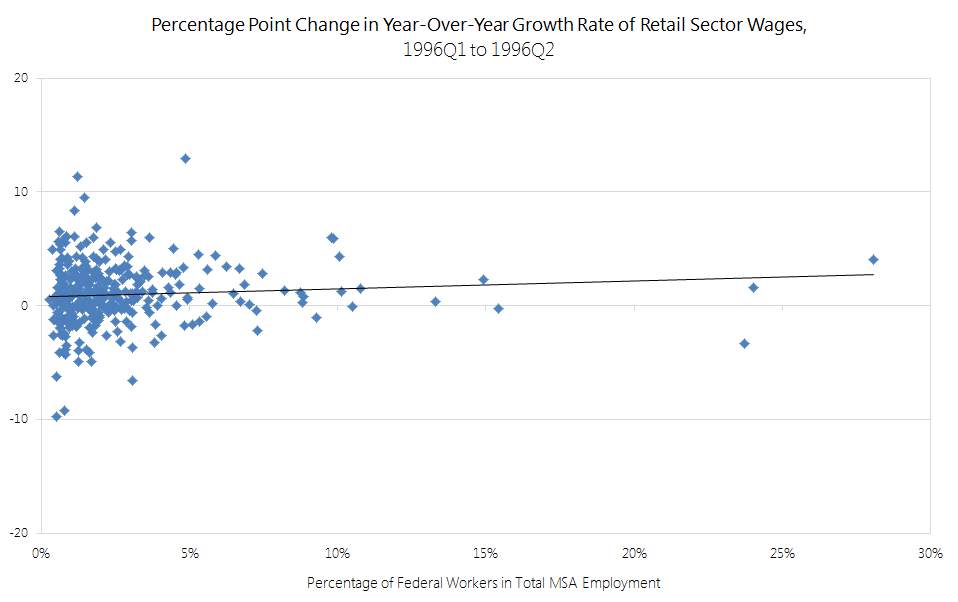
Similar to the last shutdown, Congress said it will pay the furloughed employees even though they did not work, and employment and wages in these industries quickly bounced back—and we would expect the same when the current shutdown ends. Continuing to look at the retail sector, year-over-year growth in wages in the quarter following the shutdown was positively correlated with the percentage of federal workers in a region, implying renewed demand from now-working government employees rippled out to more hours in the retail sector.
However, that quick return to growth took place in a strong mid-1990s economy. In the midst of our current slow recovery, a similarly long shutdown could be a much larger and longer setback for workers in both the public and private sectors.
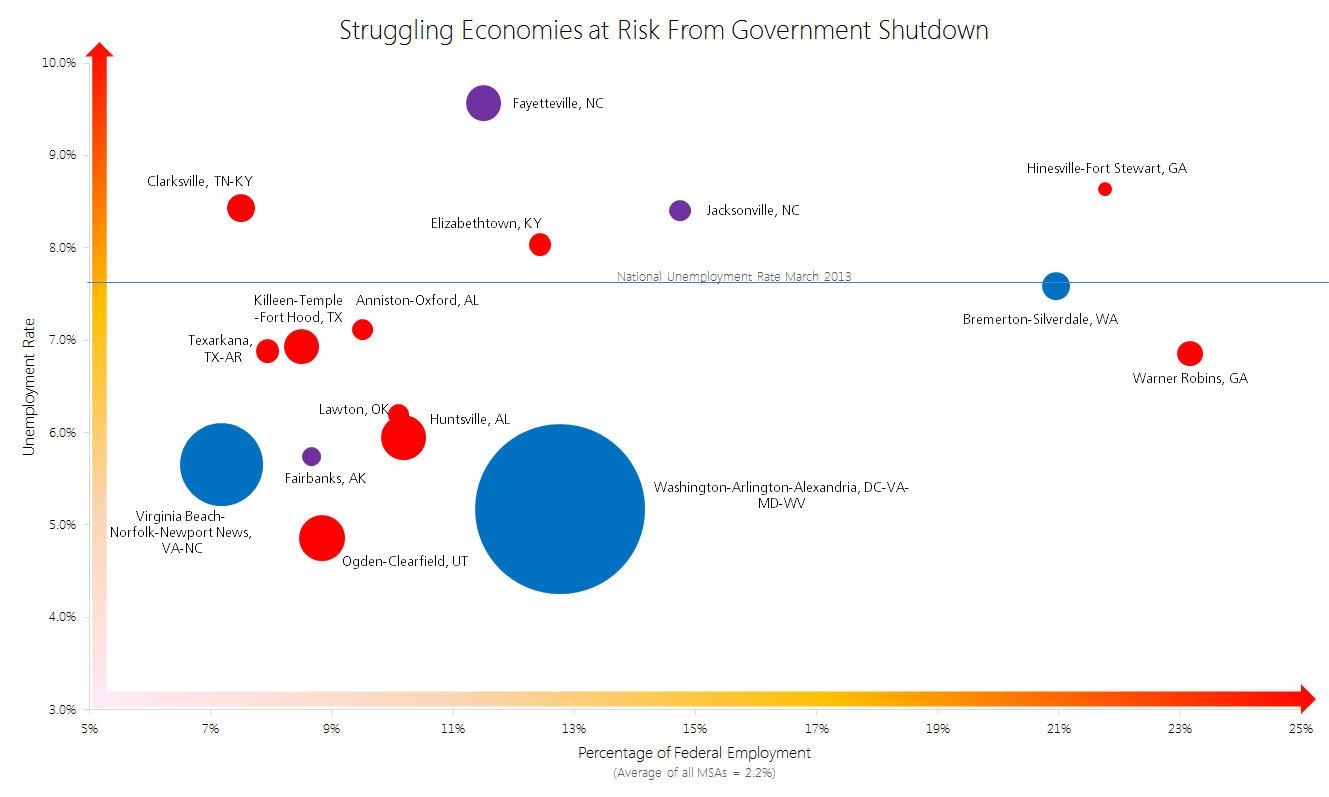
The above chart shows the MSAs most likely to be impacted by the federal shutdown based on the most recent data available. The size of each bubble represents total MSA employment, and the color of a bubble indicates the political party affiliations of the senators representing that state. MSAs closer to the top right of the chart have higher unemployment rates and a larger percentage of federal workers in their local workforce, and are expected to be hit harder by the shutdown.