Ever wonder if your colleges and universities are aligned with the needs of your industries? Sure, it is easy to pinpoint the number of engineers or biochemists in a given market, but what about the pipeline and how many employers are chasing these graduates? Put another way, given the size of the industries in your region that employ highly educated workers, is your area graduating enough postsecondary students to adequately meet demand? The answer can surprise you. In big and small markets, most areas do a good job of graduating students with some work-relevant degrees, but fall below average in some segments. A case in point, the fast growing cities of Texas are struggling to align their higher education programs with the ever evolving needs of industry in a few areas.
Chmura created its training concentration index to answer precisely this question. Is this area graduating a sufficient number of postsecondary—associate’s, bachelor’s, master’s, and doctoral degrees—students given the demands of the area’s industry mix? If the answer turns out to be a deficit in certain skills areas, companies in these sectors are either importing talent from outside the region or hiring employees without the work-related skills and background they need, and thus committing themselves longer training periods and probably more turnover.
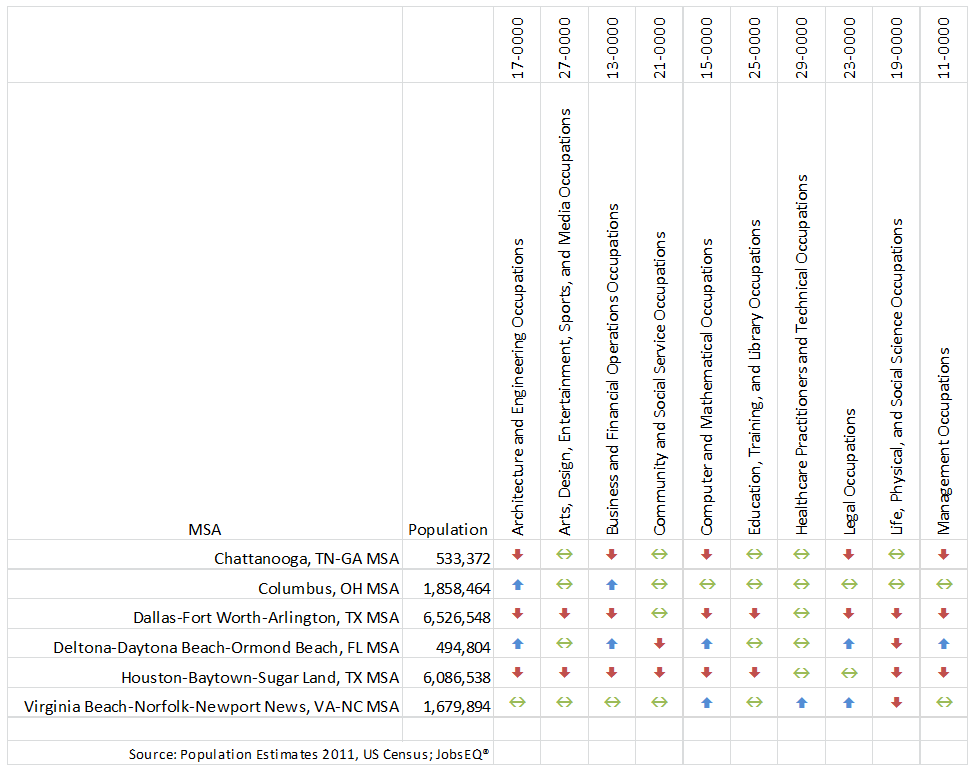
In the table below, Chmura’s economist calculated the training concentration at the 2-digit SOC aggregate level for several MSAs of different sizes. What this table showcases is that it is neither geography nor size that predicts if an area is producing a sufficient number of college graduates given the industry size and mix. In the table below, the red arrows indicate an occupational grouping where the MSA is not graduating enough degrees that track into these occupations given the size of the industries that use these employees. Green cross-arrows indicate approximate equilibrium between supply and demand for degree awards that feed into these jobs, whereas the blue arrows indicate a regional oversupply of students earning degrees that track into these positions.
This analysis helps JobsEQ® users demonstrate their area’s relative strengths in terms of the education pipeline as well as understand areas where there may be opportunity to work with local education providers to expand programs that feed into occupations important to an area’s industry clusters. JobsEQ® enables this analysis at a more granular level—for an individual occupation—and for any kind of geography—county, group of counties, or at the state or MSA level. However, when using this analytic, it is important to define your labor shed appropriately to take into account natural commuting patterns into and out of your region.